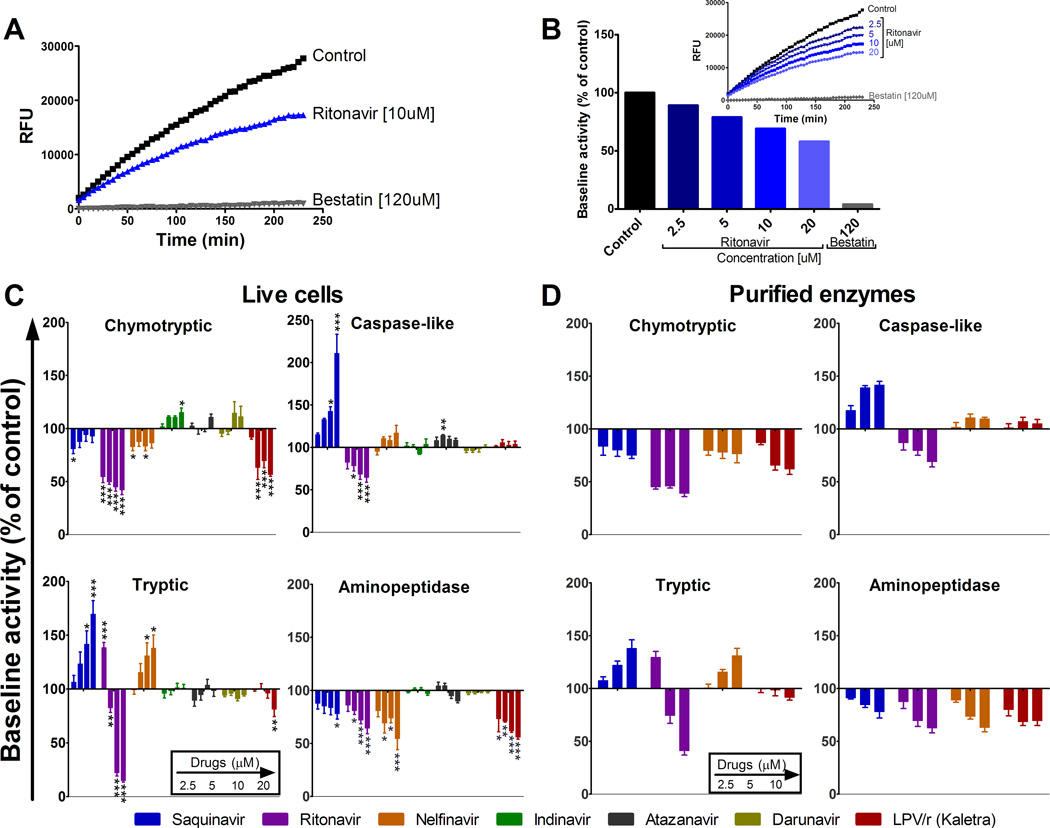
FIGURE 1.
HIV PIs variably alter proteasome and aminopeptidase activities in human PBMCs. (A) Aminopeptidase substrate Leu-amc was added to PBMCs pretreated with DMSO (control, squares), 10 µM Ritonavir (triangles) or 120 uM Bestatin (inversed triangles) and incubated for 4 h at 37 °C, during which fluorescence emission was monitored every 5 min. (B) PBMCs were preincubated with increasing concentrations of Ritonavir or 120 µM of Bestatin before addition of Leu-amc. The maximum slope of fluorescence emission over 1 h was calculated for each condition. One hundred percent represents the maximum slope of fluorescence emission of the control (153.9). Maximum slope of fluorescence upon each treatment was compared to control. (C) PBMCs or (D) Purified proteasomes or ERAP1 were pretreated with DMSO (control) or increasing concentrations of each PI (Saquinavir, Ritonavir, Nelfinavir, Indinavir, Atazanavir, Darunavir and Kaletra –left to right bars on each graph-) before adding specific substrate for each activity (chymotryptic and caspase-like (top panels), tryptic and aminopeptidase (lower panels)). In each panel one hundred percent represents the maximum slope of DMSO treated PBMCs (1161.8 for chymotryptic, 194 for caspase-like, 475 for tryptic and 1063.6 for aminopeptidase) or purified proteasomes or ERAP1 (186.8 for chymotryptic, 27.1 for caspase-like, 91.8 for Tryptic and 507 for aminopeptidase). The maximum slope of treated PBMC was compared to that of control. Average of 6–8 healthy donors. *P < 0.05, **P < 0.01, ***P < 0.001, 1-way ANOVA with Dunnett’s post-test.

