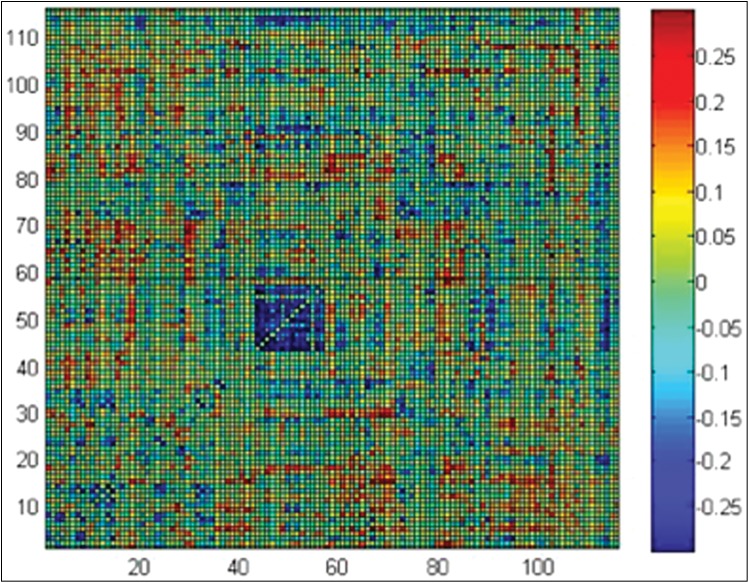
Figure 2. Difference in Fisher-transformed Correlation between Samples (Control – TS) for each Pair of 116 regions in the AAL brain atlas.
The blue square in the middle shows significantly higher correlation for TS subjects (p = 0.016) averaging correlation for all connections between occipital lobe regions (ROIs 43–56).

