
Figure 1.
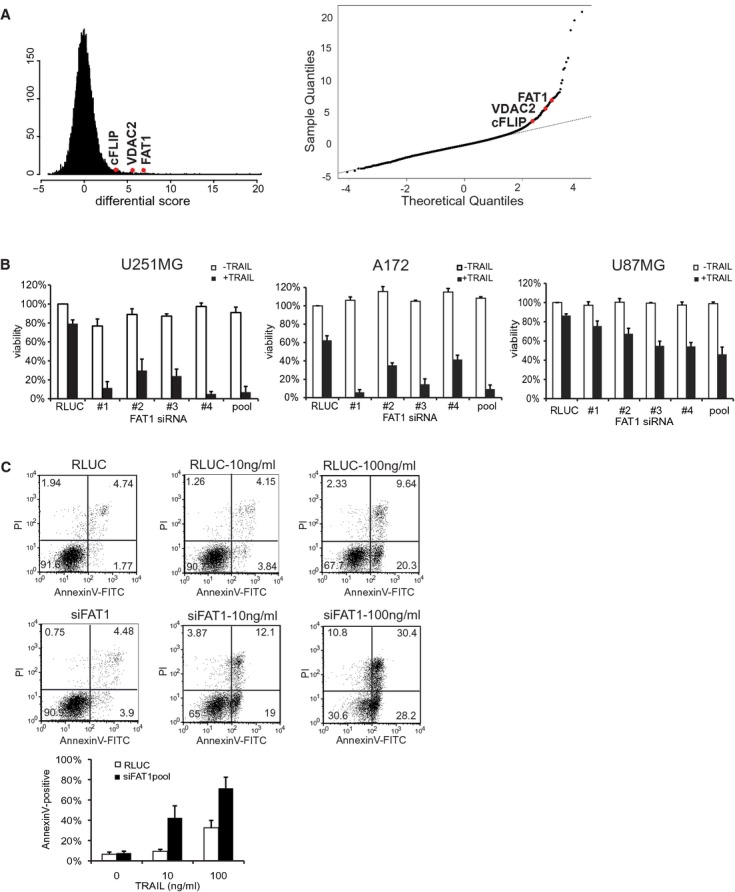
Identification of FAT1 by genome-wide siRNA-screen as TRAIL regulator.
- Left: Histogram of the calculated differential score indicates Gaussian (normal) distribution. Right: Q-Q-plot of genome-wide siRNA screen for the identification of TRAIL sensitizing siRNAs. All siRNAs deviating from the straight line indicate TRAIL sensitizers. Known anti-apoptotic regulators (cFLIP, VDAC2) and the candidate FAT1 are depicted in red.
- Glioma cell lines U251MG, A172 or U87MG were transfected with RLUC (control) or siRNA-FAT no. 1–4, pool. Cells were stimulated with 10 ng/ml TRAIL or left untreated. Viability was determined by luminescence-based CellTiterGlo-Assay 48 h after treatment. Results are shown as percentage of RLUC-untreated cells. The mean ± s.d. of at least three independent experiments is shown.
- U251MG cells were transfected with RLUC (control) or FAT1pool and treated with 10 or 100 ng/ml TRAIL. After 16 h, cells were double stained with AnnexinV-FITC and propidium iodide and analysed by FACS. The graph depicts the amount of AnnexinV-positive cells and the mean ± s.d. of four independent experiments is shown.