
Figure 2. HIF binding upregulates both the coding and non-coding transcriptome.
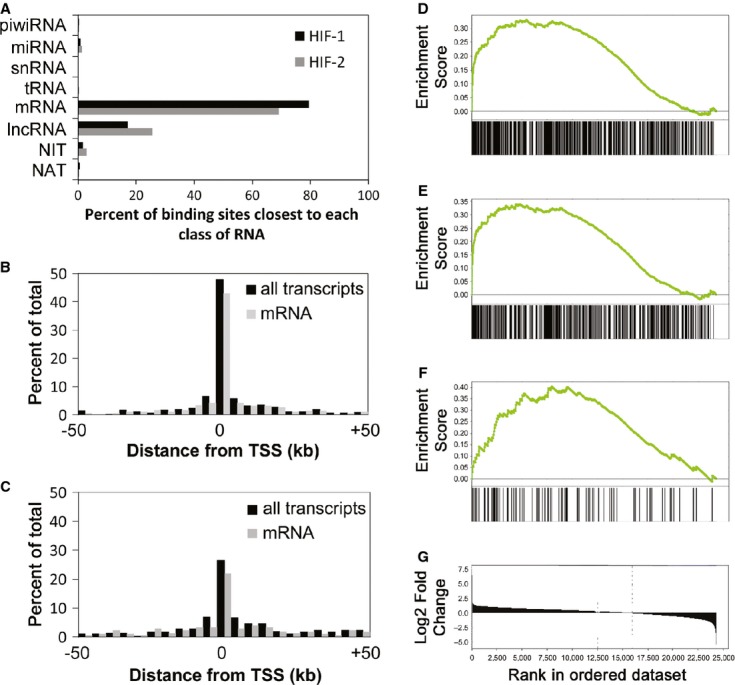
- A–C she proportion of HIF-1α and HIF-2α binding sites that are closest to transcribed loci of each RNA class (A). The distribution of (B) HIF-1α and (C) HIF-2α binding sites around the transcriptional start site of the nearest expressed gene irrespective of class (black bars). The grey bars show the distribution when only active mRNA genes are used (analogous to previous analyses).
- D–F GSEA analysis against fold-regulation by hypoxia for (D) all HIF-binding transcripts, (E) mRNA and (F) lncRNA.
- G Log2 fold-change of transcript abundance in hypoxia, ranked in order from highly upregulated to downregulated transcripts, from which the GSEA were derived.