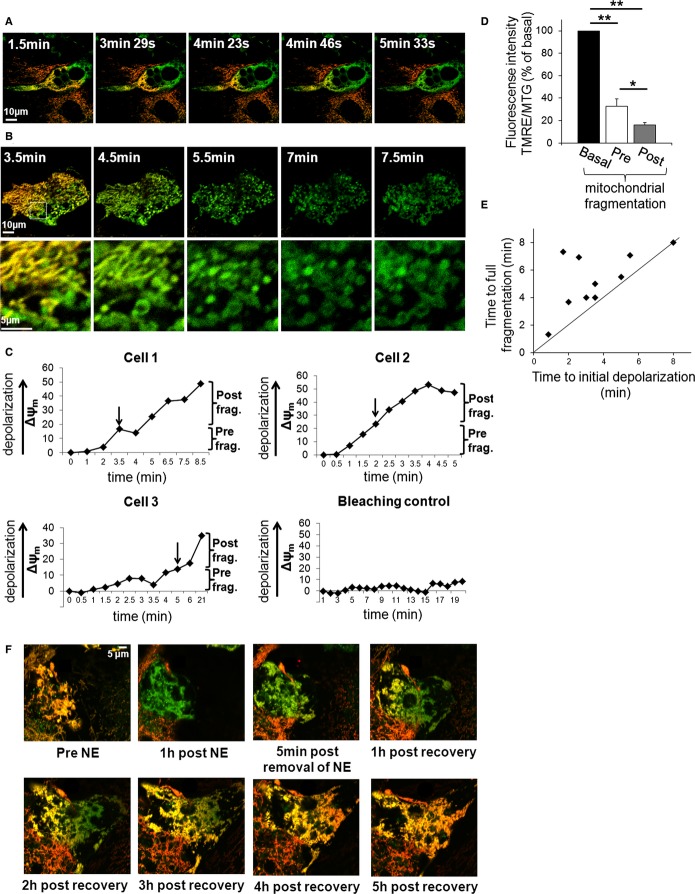
Figure 4.
- A wave of mitochondrial depolarization precedes fragmentation. Δψm depolarization in BA stained with TMRE/MTG and stimulated with NE plus palmitate. Time lapse imaging was started after the cell started to depolarize at one pole. Mitochondria that depolarize lose red TMRE staining and become green. Note how the cell depolarizes from one pole to the other in a wave-like fashion. Time indicates time lapsed after NE plus palmitate stimulation. Scale bar, 10 μm.
- A second example as shown in (A). Note that Δψm depolarization precedes fragmentation which in turn precedes swelling. Scale bars, 10 and 5 μm for the zoom images.
- Time chart of Δψm depolarization reveals that depolarization continues after mitochondrial fragmentation is completed. Cells 1–3 represent the different types of responses that were measured following stimulation with NE plus palmitate. Bleaching control represents a cell that was not stimulated in which we tested the effect of imaging on Δψm; note that there is no major change. Arrows indicate time of full mitochondrial fragmentation. Note that depolarization continues after fragmentation. Note that Cell 1 shows fast depolarization and fragmentation while cell 3 has a delayed response.
- Summary of depolarization occurring pre-and post-mitochondrial fragmentation. Note that both values are in comparison to the TMRE fluorescence intensity prior to depolarization. **P < 0.01, *P < 0.05. n = 8.
- Quantification of initial Δψm depolarization versus fragmentation. To determine the timing of depolarization versus fragmentation, BA were time-lapse imaged and analyzed for time to depolarization and fragmentation (n = 10). Cells above diagonal line fragment after depolarization. Note that Δψm depolarization always precedes fragmentation.
- Δψm repolarization in BA stained with TMRE/MTG. The cell was stimulated with NE for 1 h, followed by wash out recovery. Time lapse imaging was started prior to stimulation. Mitochondria that depolarize lose red TMRE staining and become green. Note that the cell repolarizes from one side to the other; slower albeit similar to depolarization. Scale bar, 5 μm.
Source data are available online for this figure.

