
Figure 5.
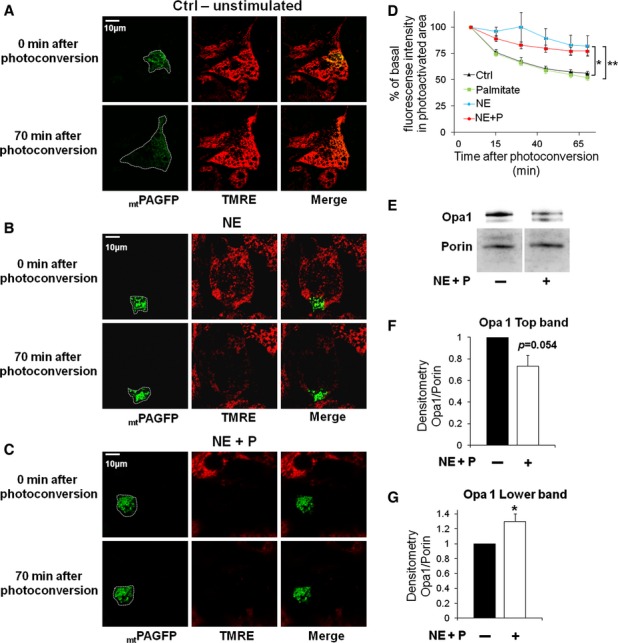
Mitochondrial fusion decreases in activated brown adipocytes. Cells expressing mtPAGFP and stained with TMRE. Fusion of the photo-converted fraction (10%) with the rest of the mitochondrial network dilutes activated mtPAGFP and leads to a reduction in fluorescence intensity. Images are representative z-projections. Time 0 indicates the time of photo-conversion. Photo-conversion was performed 30 min after stimulation with NE and/or palmitate or control media.
- Mitochondrial fusion assay in an unstimulated cell. Note the decrease in fluorescence intensity and increase in mtPAGFP area at 70 min. White line indicates area of mtPAGFP in the cell. Scale bar, 10 μm.
- Mitochondrial fusion assay in NE-stimulated cell. Note that mitochondrial fusion and movement are negligible. Scale bar, 10 μm.
- Mitochondrial fusion assay in NE plus palmitate-stimulated cell. Note that this cell showed depolarized Δψm rapidly after stimulation and that mitochondrial fusion and movement was abolished as in (B). Scale bar, 10 μm.
- Fusion kinetics is decreased in NE as well as NE plus palmitate-treated cells. Decreased fluorescence intensity over time after mtPAGFP conversion. Control and stimulated cells were photo-converted in a portion of the mitochondrial network. The dilution over time of mtPAGFP across the mitochondrial network was used as a measure of mitochondrial fusion. n = 30 (control), n = 15 (palmitate), n = 11 (NE), n = 26 (NE plus palmitate). *P < 0.05, **P < 0.01.
- Western blot showing Opa1 long (top band) and short (lower band) forms 50 min after NE plus palmitate stimulation. Porin is used as a loading control. Note that the top band decreases in intensity while the lower band increases with stimulation.
- Densitometry quantification of Opa1 long form (top band) normalized to porin. n = 4 per condition.
- Densitometry quantification of Opa1 short form (lower band) normalized to porin. n = 4 per condition. *P < 0.05.
Source data are available online for this figure.