
Figure 7.
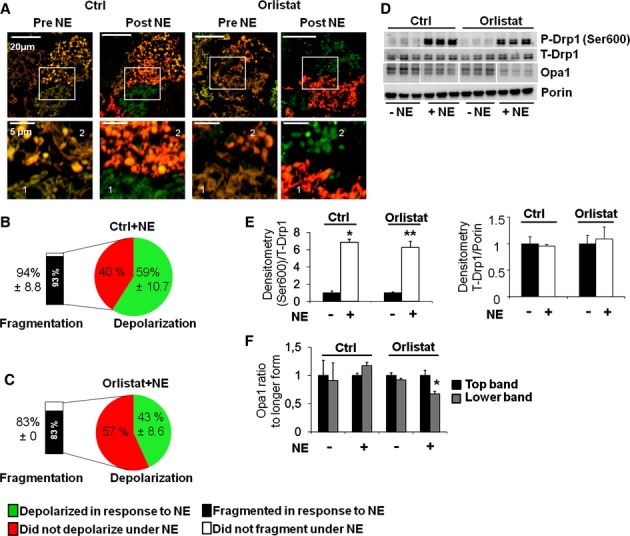
Mitochondrial fragmentation is independent of lipolysis.
A Cells stained with TMRE and MTG and imaged before and after (50 min) NE stimulation −/+ the lipolysis inhibitor Orlistat (100 μm). Cells pre-incubated with Orlistat are compared to control cells (vehicle). Note that Orlistat-treated cells still show fragmented mitochondria after NE stimulation. Scale bars, 20 and 5 μm for the zoom images.
B, C Quantification of the fraction of cells that undergo Δψm depolarization in response to NE as indicated. The fraction of mitochondrial fragmentation was quantified in cells in which depolarization did not occur. Note that Orlistat did not reduce significantly the fraction of cells that fragmented their mitochondria in response to NE. Orlistat reduced the fraction of the cells that undergo depolarization in response to NE, but did not affect mitochondrial fragmentation. Numbers are Mean % of cells ± s.d.
D Western blot for total Drp1, phosphorylated Drp1 (Ser600) and Opa1 under control and Orlistat. Porin is used as a loading control. Note that Orlistat does not reduce the increase in Ser600 phosphorylation with NE stimulation (50 min). n = 3 per condition.
E Quantification of Western blot analyses for phosphorylated Drp1 (Ser600) and total (T-) Drp1 shown in (D), normalized to T-Drp1 and Porin respectively. *P < 0.0002 and **P < 0.002.
F Quantification of Western blot analyses for Opa1 (Top and Lower bands) shown in (D), normalized to Porin and Top band. *P < 0.04. Note that Orlistat prevents Opa1 cleavage after NE stimulation.
Source data are available online for this figure.