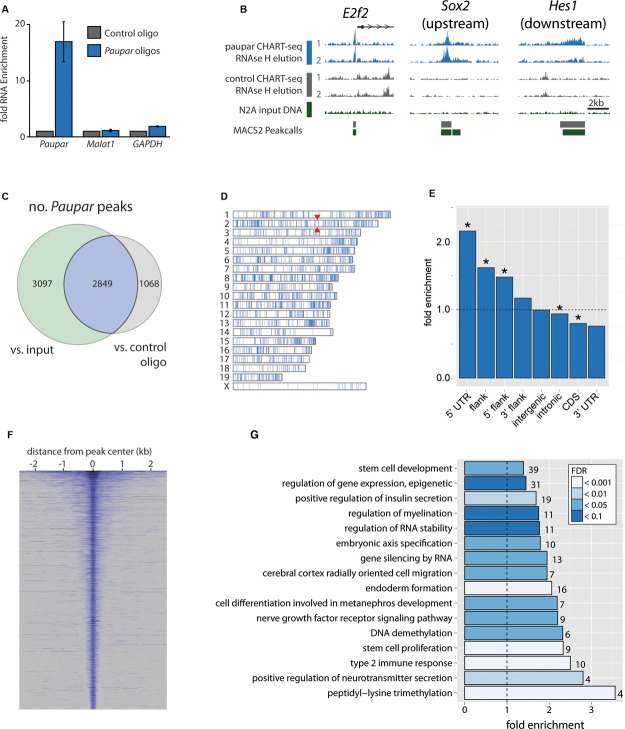
Figure 4.
- A Specific enrichment of Paupar RNA using oligonucleotides complementary to accessible regions of Paupar, as determined by RNase H mapping (see Supplementary Fig S4), compared to the LacZ control. Mean value ± s.e., n = 4.
- B Sequencing of Paupar-bound DNA (RNase H elution) reveals peaks of Paupar binding, including those at the promoter of E2f2, upstream of Sox2 and downstream of Hes1.
- C–E Peaks were called by comparing with sequences both from control CHART-seq experiments and from input DNA. Here we only consider the 2,849 peaks common to both comparisons (C, and Supplementary Table 4). Paupar peaks are broadly distributed across the mouse genome (D) but are particularly enriched in 5′ UTRs and gene promoters (E). Red arrowheads in (D) indicate the position of the Paupar locus. Asterisks in (E) indicate significance at 5% FDR (Benjamini-Hochberg).
- F The width distribution of Paupar binding peaks.
- G Representative categories from Gene Ontology analysis of genes associated with Paupar binding sites reveal enrichments for stem cell and neuronal categories amongst others (Supplementary Table 6).

