
Figure 5.
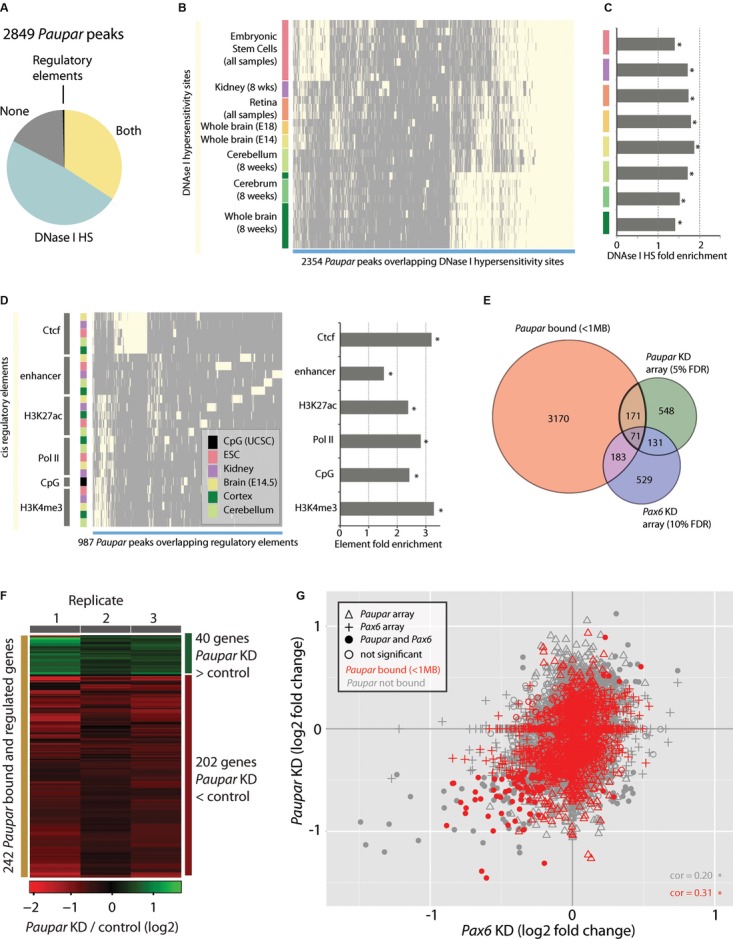
Association of Paupar binding sites with regulatory regions
- The majority of Paupar binding sites overlap with DNase I HS sites and transcriptional regulatory elements as identified by the ENCODE project (selected tissues; Supplementary Table 5).
- Hierarchical clustering of HS sites intersecting Paupar binding sites (light yellow) reveals large clusters of HS sites identified in neural tissues and embryonic stem cells that are bound by Paupar in N2A cells.
- Fold enrichment of Paupar CHART-Seq-DNase I HS site associations.
- Hierarchical clustering of cis-regulatory elements and Paupar peaks show groups of Paupar peaks associated with promoter-like features (H3K4me3, Pol II binding, CpG island predictions), peaks associated with Ctcf and peaks associated with tissue-specific enhancer elements.
- The intersection of genes proximal (< 1 Mb) to Paupar peaks and genes changing expression upon Paupar (5% FDR) and Pax6 (10% FDR) knockdown.
- Heatmap displaying expression changes in the 242 Paupar bound and regulated genes from (E).
- Analysis of Paupar-associated genes and changes in expression from Paupar and Pax6 knockdown array experiments reveals a set of genes positively regulated by both Paupar and Pax6 and directly bound by Paupar (red circles, lower left). Correlations (cor) are significant at P < 2 × 10⁻¹⁶.