
Fig 1.
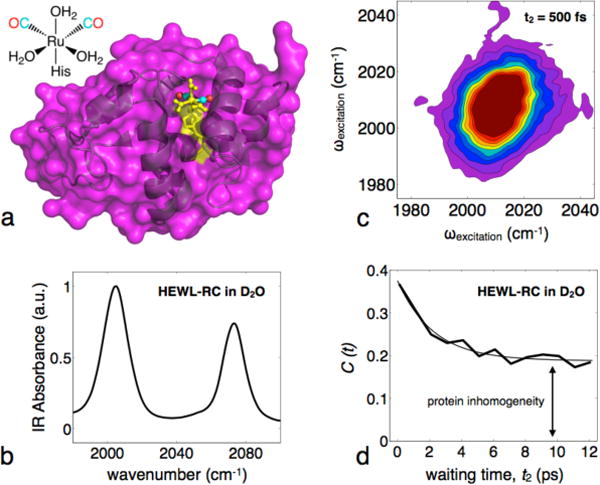
Crystal structure of HEWL-RC, linear and 2D-IR spectra, example FFCF. a, Structure of the metal-carbonyl vibrational probe and the crystal structure of the His 15 labeled HEWL carbonyl complex (probe site highlighted in yellow). b, Linear FTIR spectrum and (c) 2DIR spectrum shown for the metal-carbonyl CO region. d, Example of a typical frequency-frequency correlation function, showing an initial decay on the order of a few picoseconds corresponding to the hydration dynamics, followed by a static offset due to protein inhomogeneity that is not sampled within the experimental window.