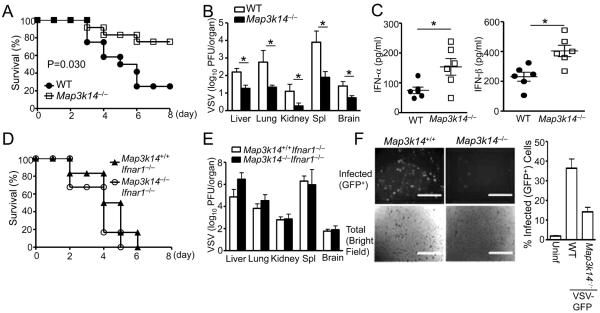
Figure 1. NIK deficiency potentiates antiviral immunity.
(A–C) Age-matched (6–8 weeks old) WT and Map3k14−/− mice, bred to the Rag1−/− background, were infected i.v. with VSV (2×10⁷ PFU per mouse). (A) Survival curves (n=12). (B) Tissue VSV titers on day 3 of infection. (C) Serum concentrations of IFN-α and IFN-β at 12 h of infection. Data are presented as mean ± S.D. of six animals.
(D–E) WT and Map3k14−/− mice, bred to the Rag1−/−-Ifnar1−/− background, were infected i.v. with VSV (2×10⁷ PFU per mouse). (D) Survival curves (n=6). (E) Tissue VSV titers on day 3 of infection. Data are presented as mean ± S.D. of six animals.
(F) WT or Map3k14−/− primary MEFs were infected with GFP-expressing VSV (VSV-GFP) at a MOI of 0.1 for 24 hr. Data are presented as a representative picture, showing the infected (GFP+) and total (bright field) cells (left). The sacle bar indicated as length of 1000μm. The summary graph of flow cytometric quantification of the infected cells (right). Data are representative of 3 independent experiments, and statistical analyses represent variations in technical replicates. *P<0.05. See also Figure S1.

