
Figure 1.
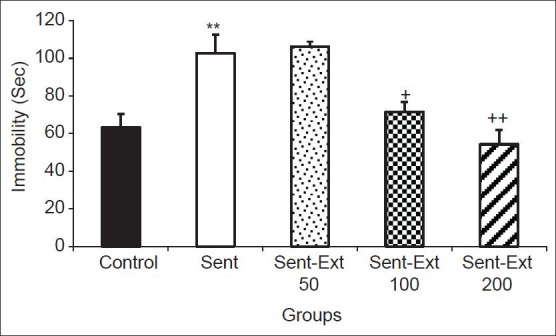
Comparison of immobility times in the forced swimming test between five groups. Data are expressed as mean ± standard error of the mean (n = 10 in each group). **P < 0.01 comparison of sensitized group with control group, +P < 0.05 and ++P < 0.01 comparison of sensitized animals treated by 100 and 200 mg/kg of the extract respectively groups with non treated sensitized group. The two ANOVA followed by Tukey post hoc test. The criterion for the statistical significance was P < 0.05