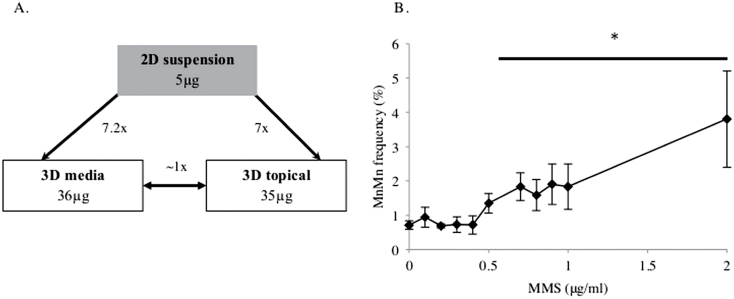
Fig. 9.
(A) Summary of the differences in micronucleus induction in different 2D and 3D cell culture systems in terms of total µg applied to the system. The 2D dose–response referred to is shown in Figure 9B. (B) Micronucleus frequency in mononucleate human lymphoblastoid TK6 cells, following 24h treatment with MMS and 24h recovery post-treatment (n = 3). A LOGEL was identified at 0.5 µg/ml (P < 0.05). *Represents a P ≤ 0.05 relative to the untreated control.

