
Figure 3.
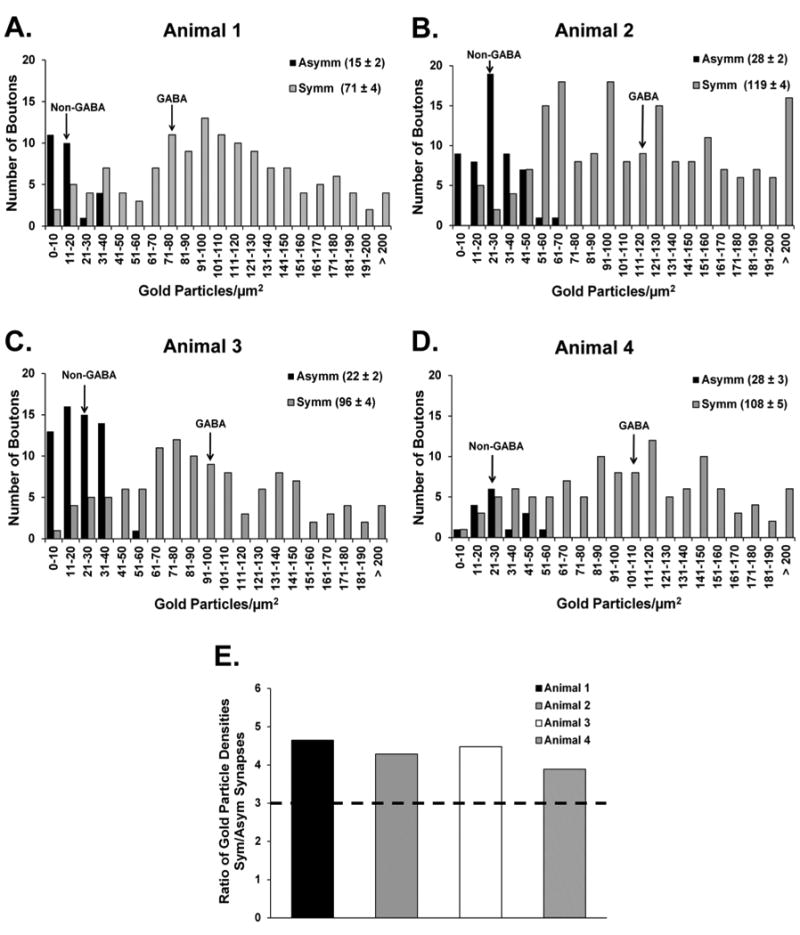
Frequency distribution histograms of the relative gold particle density in terminals forming synapses with ChAT-labeled elements in the four animals used for the GABA (immunogold) and ChAT (immunoperoxidase) reactions in the monkey putamen. A–D: Histograms showing the overall distribution of gold particle densities over terminals forming symmetric (Symm) or asymmetric (Asymm) synapses with ChIs in the postcommissural putamen of each of the animals. The average surface density of gold particles (± SEM) measured in each category of terminals is provided in the legend at the upper right corner of each panel and is indicated by arrows in the histograms pointing to the non-GABA and GABA means for each animal. The symmetric and asymmetric terminals analyzed in each monkey were collected from blocks of striatal tissue processed from the same double-label immunoreaction. E: Comparison of the average ratio of gold particle densities over terminals forming Symm versus Asymm synapses with cholinergic elements in each monkey. A gold particle density ratio of 3 (dashed line in E) between Symm and Asymm terminals served as an (arbitrary) cutoff to separate confirmed GABAergic from “unknown” symmetric terminals.