
Fig. 5.
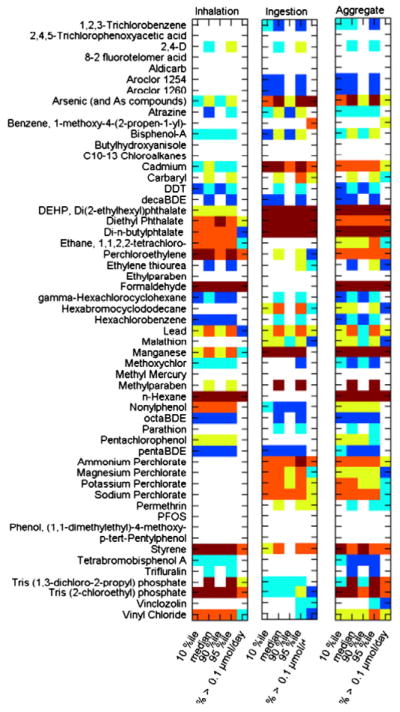
Summary of “Tier 2” estimates of quantitative metrics of exposure of the general population of the US for the 55 chemicals. Rankings are color coded based on values from 1 to 5 as shown in the legend and white (empty) cells indicate no data (ND) were available.