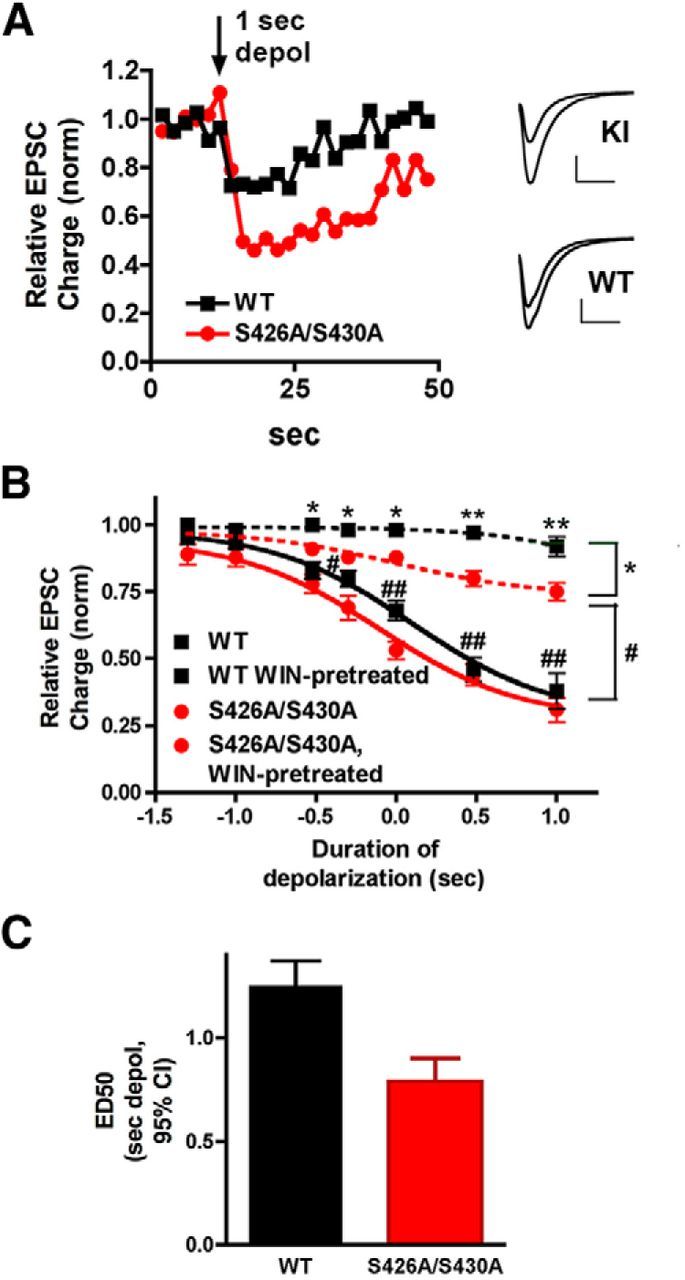
Figure 4.

S426A/S430A hippocampal neurons have enhanced DSE and desensitize more slowly. A, Sample DSE time courses in WT and S426A/S430A autaptic neurons in response to a 1 s depolarization. Inset shows sample EPSCs for S426A/S430A and WT neurons before and after the 1 s depolarization. B, Depolarization response curves in WT (black diamonds, solid line) and S426A/S430A neurons (red circles) show that the response in S426A/S430A neurons is shifted to the left. In addition, S426A/S430A neurons (red triangles, dotted lines) desensitize to a lesser extent after overnight treatment with the CB1 agonist WIN55,212-2 (100 nm) compared with WT neurons (black squares, dotted line). Brackets on right indicate grouping for statistical comparisons: top (*) compares WT-WIN-treated to S426A/S430A-WIN-pretreated; lower (#) compares WT to S426A/S430A-WIN-pretreated. *p < 0.05, **p < 0.01, #p < 0.05, ##p < 0.01, two-way ANOVA with Bonferroni post hoc test. C, Bar graph shows ED50 for “depolarization response curves” in WT vs S426A/S430A neurons derived from the solid curves in B. The ED50 refers to the duration of depolarization that is required to obtain a 50% maximal DSE inhibition. Values are in seconds with 95% CIs.
