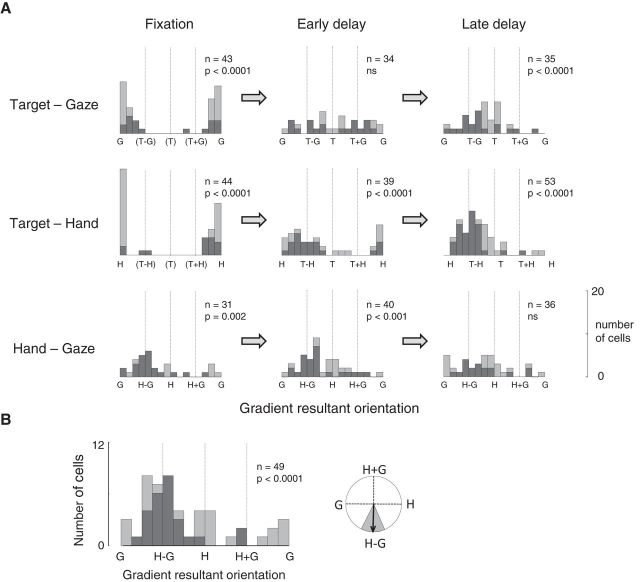
Figure 6.
Area 5d codes the hand position relative to gaze before target presentation, but codes the reach vector as movement onset approaches. A, Histograms show the distribution of orientations of the matrix gradient resultants and SVD analysis for the population of tuned cells at three epochs during the task (fixation, early delay, and late delay). Each stacked bar represents 22.5° of the circular orientation plot; pale gray indicates separable responses and dark gray indicates inseparable responses. p values show the results of the Rayleigh test for uniformity, corrected for multiple comparisons. B, Histogram for the HG variable pair as described in A, but showing results when trials were collapsed across upcoming target positions (left). Mean gradient resultant orientation when trials were collapsed was −91°; the shaded area represents 95% confidence limits (right).

