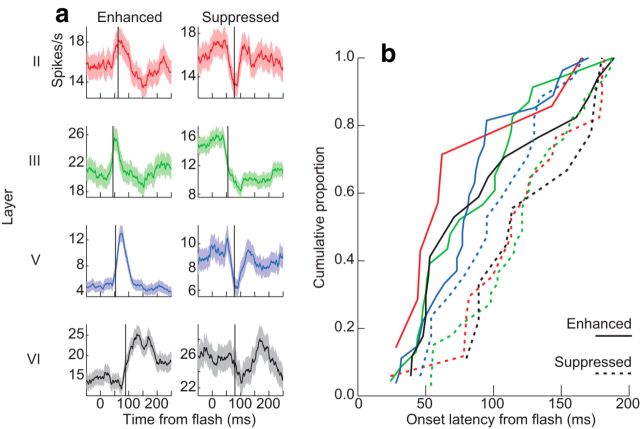
Figure 10.
Single and multi-unit visually evoked response latencies to flashed stimuli. a, Representative units recorded from layer II (red), layer III (green), layer V (blue), and layer VI (black) demonstrating either enhanced (left) or suppressed discharge (right) rates following the stimulus. Shaded areas indicate the 95% confidence intervals measured across stimulus presentations. Vertical lines mark response latencies. b, Cumulative distributions of unit response latencies separated by layer and response type. Enhanced responses showed shorter latencies than suppressed responses. See also Table 1.

