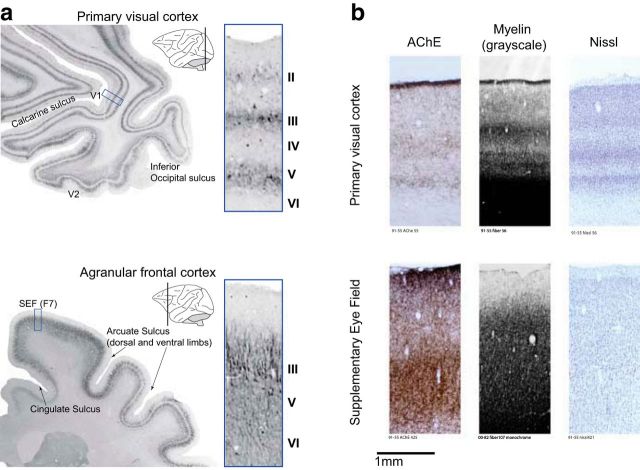
Figure 2.
Cytoarchitecture of agranular frontal cortex compared with visual cortex. a, Data reproduced from Paxinos et al. (2000) with permission. Sections were reacted immunohistochemically for the demonstration of neurofilament protein SMI32. Sulcal landmarks and specific areas are labeled to aid in orientation (V1, primary visual cortex; V2, visual area 2). Schematic insets show approximate planes from which sections were taken. Areas outlined in blue are magnified at right. V1 can be clearly delineated by laminae and shows a distinct layer IV separating layers III and V. In contrast, SEF exhibits clusters of pyramidal cells in layer III with less dense pyramidal cells in layer V (Geyer et al., 2000). b, Comparison of laminar distribution of acetylcholinesterase (AChE), myelin fibers, and Nissl substance in primary visual cortex (top) and SEF (bottom). Each pair represents tissue taken from the same monkey. The pronounced laminated structure of visual cortex contrasts with the more homogeneous appearance of SEF. The laminar pattern of AChE staining in SEF is very different from that in primary visual cortex, being most dense in layer I and dense as well in layers V and VI. Likewise, the laminar pattern of myelin fiber staining in SEF is markedly different from that in primary visual cortex, lacking lamination and most dense only up to layer II. Nissl sections show that SEF is quite distinct from primary visual cortex with no clear boundary separating the homogeneous layers II and III that contain mostly small pyramids except in the lowest part of III in which medium-size pyramids are present. Layer VI contains mainly fusiform cells and can be divided by cell density into superficial, relatively sparse and deeper, relatively dense sublayers (Matelli et al., 1991).

