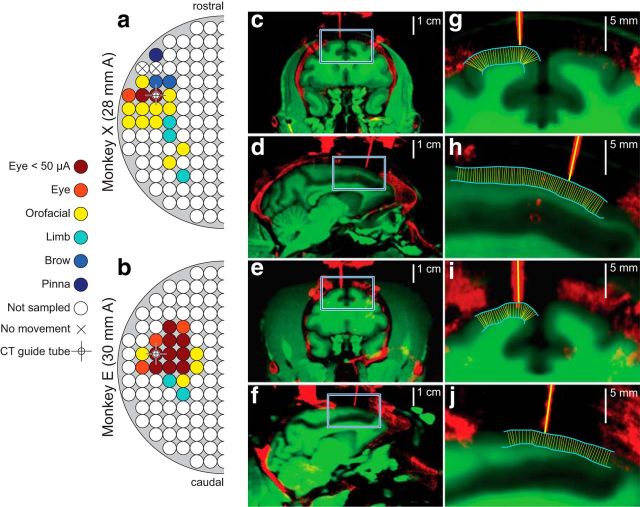
Figure 3.
Location and penetration angle of recordings. a, b, Maps derived from effects of intracortical electrical microstimulation in each monkey. The anterior location of the center of the chamber is indicated at left. Circles depict grid hole locations spaced 1 mm apart. Legend shows the types of movement elicited with 50–200 μA of injected current. Crosshairs show the locations of guide tubes in CT images on right. c–j, Coregistered MR (green) showing soft tissue including gray matter and white matter with CT (red) showing bone, stainless steel chamber adapters, titanium screws, titanium headposts, some dental acrylic used in the implants, and stainless steel guide tubes. c, d, Show coronal and sagittal planes for monkey X. e, f, Show coronal and sagittal planes for monkey E. Blue squares in c–f are magnified in g–j. Cyan lines in g–j show pial surface and transition from gray matter to white matter. Thin yellow lines show the result of an automated algorithm that minimized distance between the pial surface and gray matter to calculate angles perpendicular to gray matter (see Materials and Methods). Thick yellow lines plot the trajectory of electrode arrays based on the orientation of guide tubes. Thick and thin yellow lines are virtually parallel at points of entry. This orientation validates the CSD measurement.

