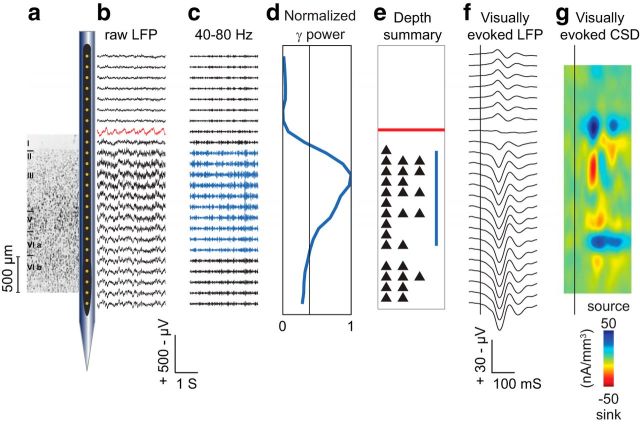
Figure 4.
Raw and processed data from a representative session (1316 trials). a, Schematic diagram of electrode array drawn to scale and positioned on Nissl section from SEF (adapted from Matelli et al., 1991 with permission). b, Three seconds of raw LFP recorded from each of the contacts. The red trace (eighth from top) shows pulse artifact. c, LFP bandpass filtered from 40 to 80 Hz. Blue traces show γ activity elevated above the mean. d, Normalized mean γ power recorded at each electrode contact across session (blue) compared with average γ power recorded across all contacts (vertical black line). Note the pronounced increase in γ power at the contacts in the neuropil. e, Summary figure showing depth of pulse artifact (red line), elevated γ power (blue line), and the number of well isolated single units (black triangles) recorded simultaneously. During this session, we recorded 29 well isolated single units with 2 units on 5 channels and 3 units on another 5 channels. f, Three hundred milliseconds of event-related LFP aligned to the flash stimulus (vertical black line). Note the reversal in voltage polarity occurring on the channel with the pulse artifact. Above this channel the signal is volume-conducted EEG in the saline filling the recording chamber. Below this channel, the signals represent the electrocorticogram recorded from the pial surface and the LFPs recorded from the gray matter. g, Three hundred milliseconds of CSD derived from the LFPs, interpolating between contacts with 10 μm resolution. Vertical black line shows onset of flash stimulus.

