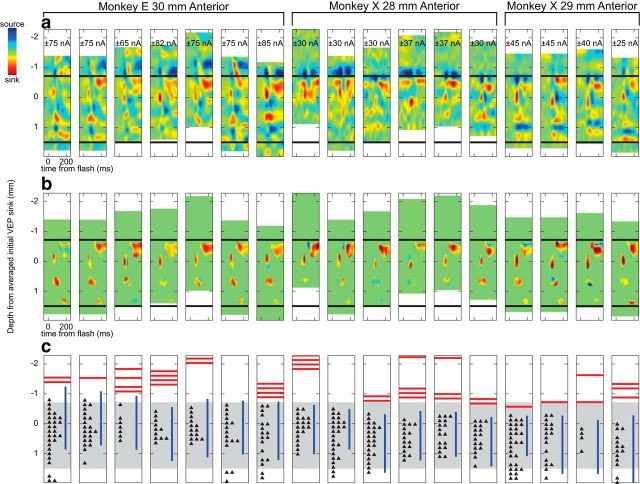
Figure 5.
Results of the automated procedure for aligning U-probe recordings across sessions. A, Visually evoked CSD recorded individually for each session. The monkey and location of each penetration are indicated above. The recordings are aligned from left to right in chronological order within each monkey. Numbers near the top indicate the scales of the CSD maps (nA/mm3). Horizontal black bars indicate the estimated average location of gray matter based on the physiological signals. b, Visually evoked CSDs masked to show locations of the four grand-averaged, visually evoked sinks reported in Figure 6. Note the close correspondence in location of these sinks across recording sessions demonstrating the similarity in CSD recorded on subsequent days, and the success of our automated alignment procedure. c, Physiological signals apparent in the raw data on individual sessions. Pulse artifact (red lines), elevated γ activity (blue lines), and single units (black triangles) show good correspondence with our estimate of the location of gray matter (gray shading).

