
Figure 7.
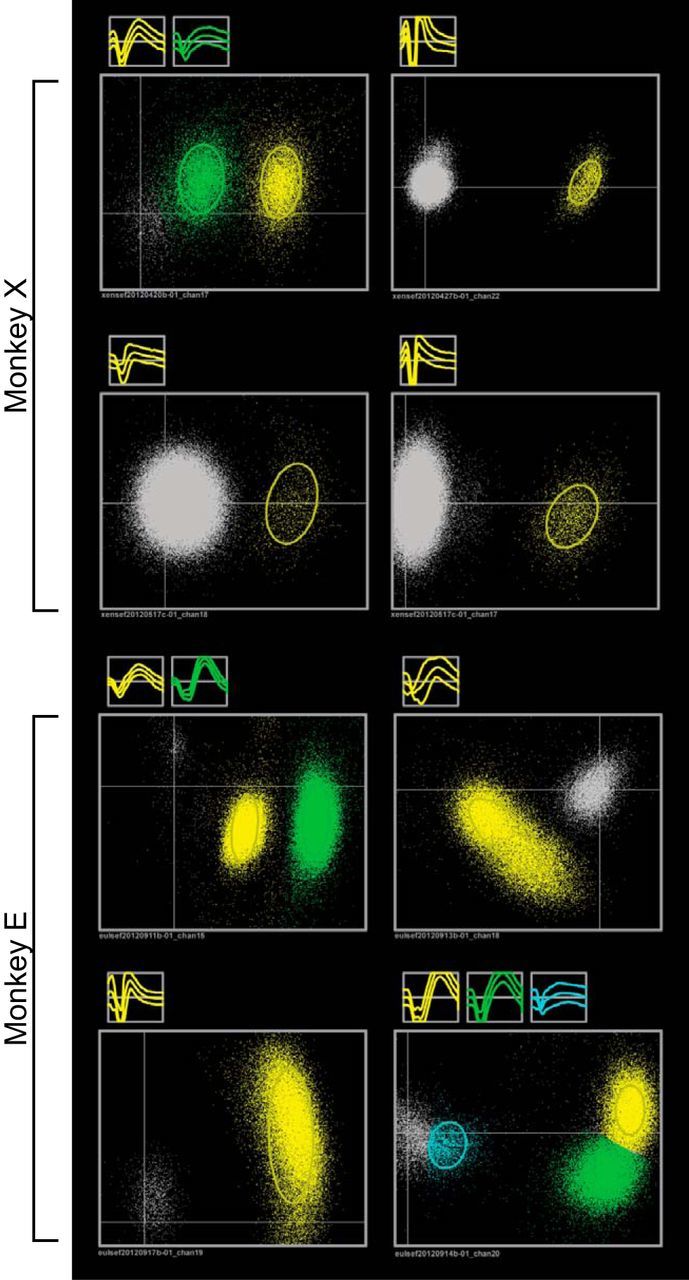
Sample waveforms and projected PCA space for eight sorted channels. Gray clouds represent multi-unit activity (unsorted threshold crossings). Channels 1–4 are from recordings with monkey X and channels 5–8 are from recordings with monkey E.