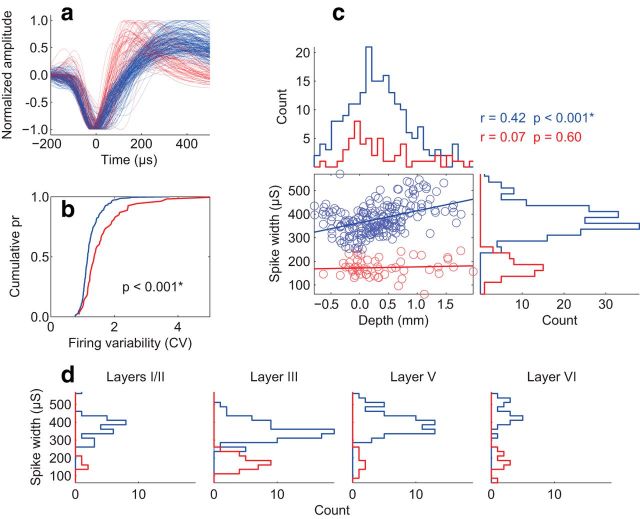
Figure 8.
Biophysical characteristics of single units. a, All biphasic waveforms in population. Red and blue denote narrow and broad spikes, respectively (split at 250 μs). This color code is the same in the remaining parts. b, Cumulative probability distributions of CV of interspike intervals plotted separately for broad-spiking and narrow-spiking units. Narrow-spiking units showed more variability in spike timing. c, Spike width as a function of recording depth. Scatter plot shows regression of spike width by depth separated by broad- and narrow-spiking populations. Histograms show distributions of broad- and narrow-spiking units across each dimension. Broad-spiking units increased in width with depth. No such trend was observed for narrow-spiking units. d, Counts of broad-spiking and narrow-spiking units recorded in each layer.

