
Figure 9.
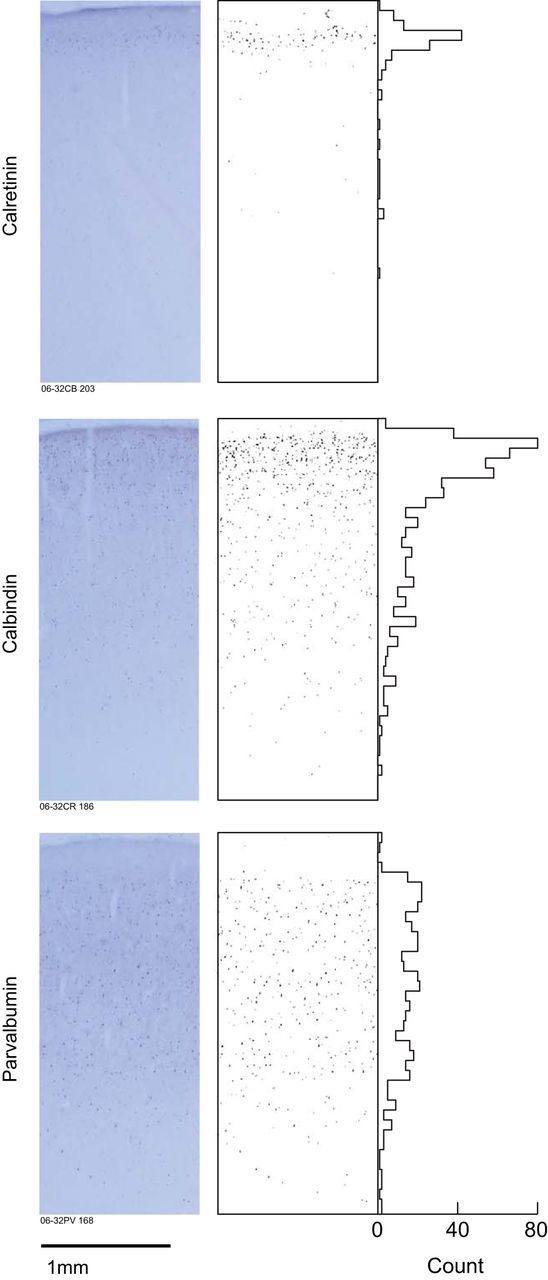
The distribution of GABAergic interneurons in SEF. Left, Shows coronal sections through SEF immunohistochemically reacted for the calcium binding proteins indicated. Right, Plots the location of positive neurons identified using a semi-automatic classification routine (see Materials and Methods) with associated histograms of cell counts as a function of depth. Calretinin and calbindin neurons are densest in layer II with diminishing deeper density, while parvalbumin neurons are more uniformly distributed across layers.