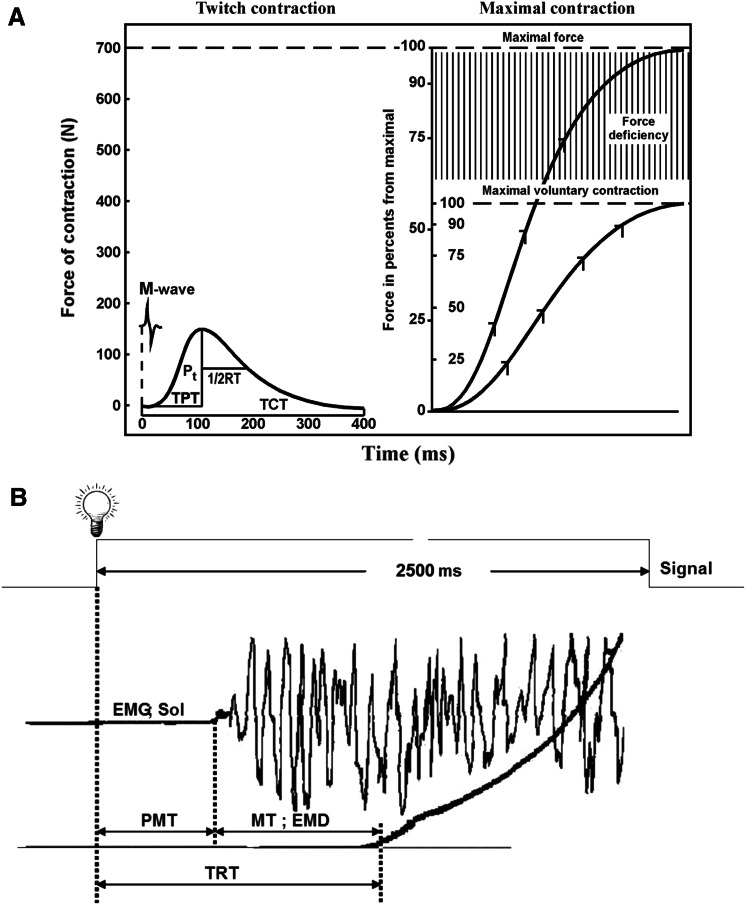
Fig. 1.
a Examples of isometric twitch contraction curves (left panel) and electrically evoked tetanic tension and voluntary muscle tension development (right panel) showing how the parameters of the mechanical responses of muscle contraction were subsequently calculated. TPT time-to-peak tension, 1/2 RT half-relaxation time, TCT total contraction time, P t twitch force. b Schematic representation of a sample contraction showing total reaction time (TRT) with its premotor (PMT) and motor (MT) components, force–time curve and EMG recorded from m. soleus

