
Fig. 1.
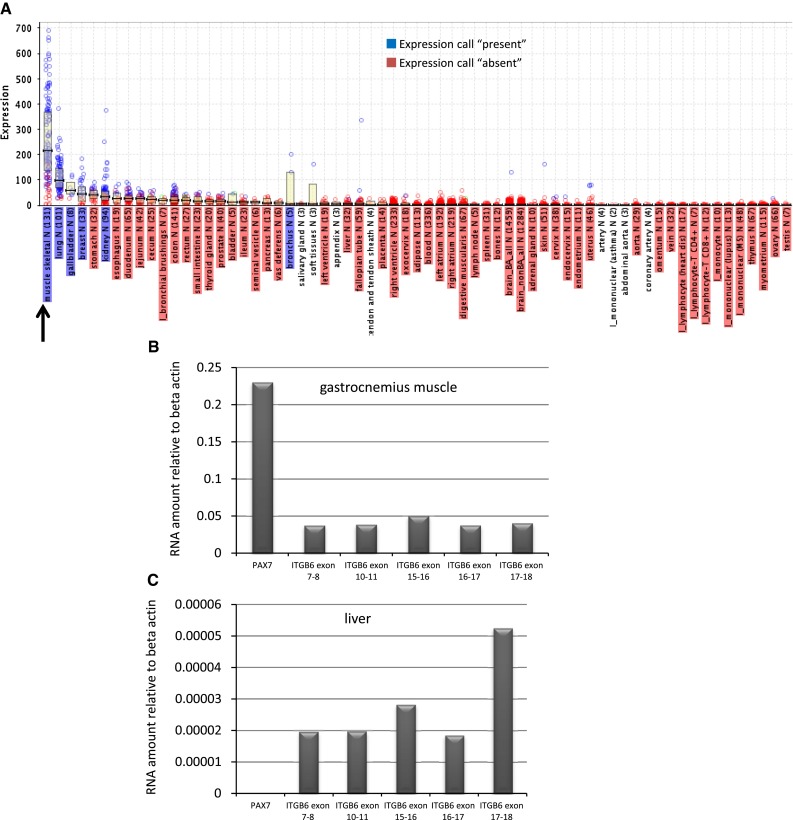
Itgb6 RNA expression. a Plot of probe level intensity for Affymetrix probe 208084_at corresponding to the human ITGB6 transcript for a survey panel of tissues and cell types. The arrow denotes the skeletal muscle samples. b Taqman qPCR data from skeletal muscle RNA for multiple exons of Itgb6 and Pax7 (a positive control for muscle gene expression). c Taqman qPCR data from liver for multiple exons of Itgb6 and Pax7 (not detected in liver as expected)