. 2014 Apr 15;3:e01861. doi: 10.7554/eLife.01861

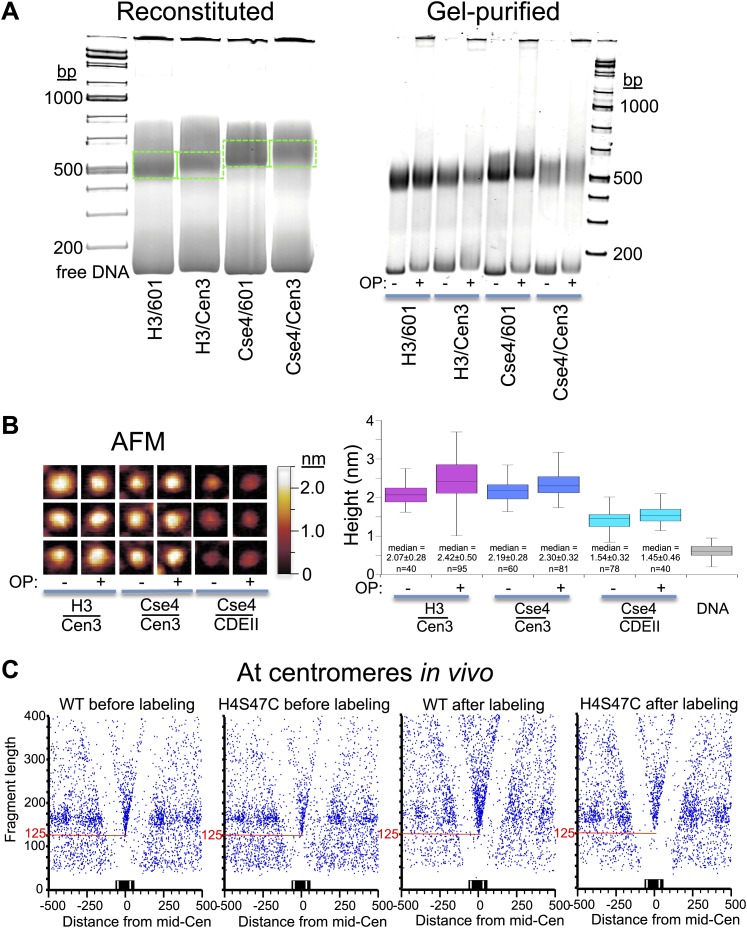
Figure 7. OP-labeling does not disrupt reconstituted or native nucleosomes.

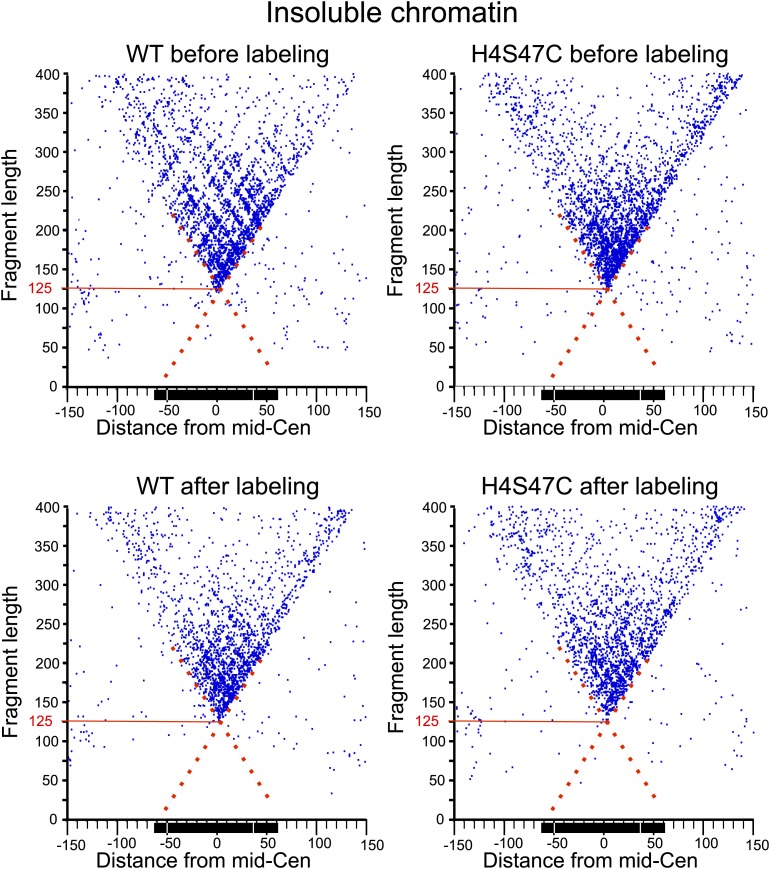
(A) Octasomes were reconstituted by salt dialysis on 147-bp DNAs, subjected to native PAGE (left), and gel-shifted bands were excised (dotted green lines) and extracted as described (Codomo et al., 2014). OP-treated and untreated gel-purified particles were subjected to native PAGE (right). No instability of Cse4/Cen3 octamers (Dechassa et al., 2011) was observed during low-temperature incubation during storage at 4°C (Xiao et al., 2011; Furuyama et al., 2013). Using the intensity ratio of the gel-shifted band to the free DNA band as a measure of octasome stability, stability in the presence or absence of OP reagent was similar in each case (Fraction +OP/-OP: H3/601: 0.8; H3/Cen3: 1.0; Cse4/Cen3: 1.1; Cse4/Cen3; 1.0), based on the average of two determinations. (B) AFM analysis of reconstituted particles ± OP treatment. Three representative particles from each sample are shown on the left at the same magnification and dynamic range, where the height was set at 0.6 nm below the mean height of free DNA imaged in the same scan. The median heights for 1 min trypsinized OP-treated and untreated H3 and Cse4 octasomes and Cse4 hemisomes are similar to what we previously reported using the same protocol (2.10 nm for Cse4/Cen3 octasomes and 1.59 nm for Cse4/CDEII hemisomes [Codomo et al., 2014]). (C) MNase-seq was performed on wildtype (WT) and H4S47C mutant cells ± OP labeling. The mid-CDE position of each of the 16 centromeres was aligned at zero on the X-axis position. A blue dot corresponds to the midpoint of each mapped fragment on the X-axis and the fragment length on the Y-axis. The sharp vertex located over the mid-Cen marks the X-axis position of the minimally protected fragment and its Y-axis position (red line) indicates its length. See also Figure 7—figure supplement 1–5.

DOI: http://dx.doi.org/10.7554/eLife.01861.018

Figure 7.

Figure 7—figure supplement 1. MIdpoint V-plot representations of MNase-seq generated fragments from insoluble chromatin over all 16 centromeres.

Figure 7—figure supplement 1.

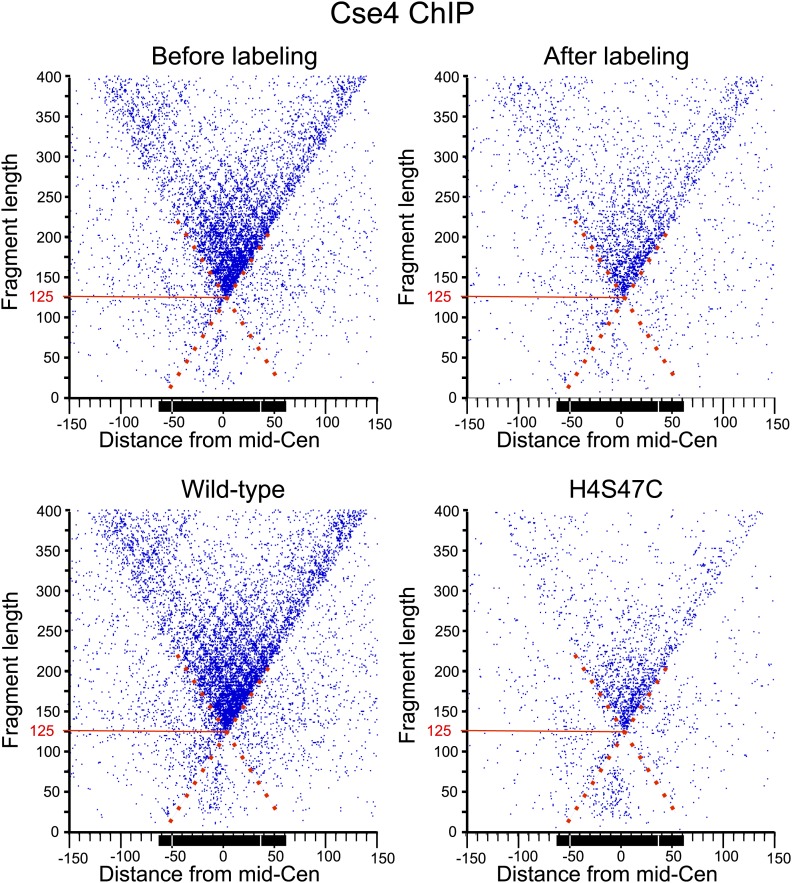
See the legend to Figure 7C. The dotted line extensions of the diagonals show precise positioning of protected particles over the centromere, and the solid red lines mark the length of the minimally protected fragment.
Figure 7—figure supplement 2. MIdpoint V-plot representations of Cse4 ChIP fragments over all 16 centromeres.

Figure 7—figure supplement 2.

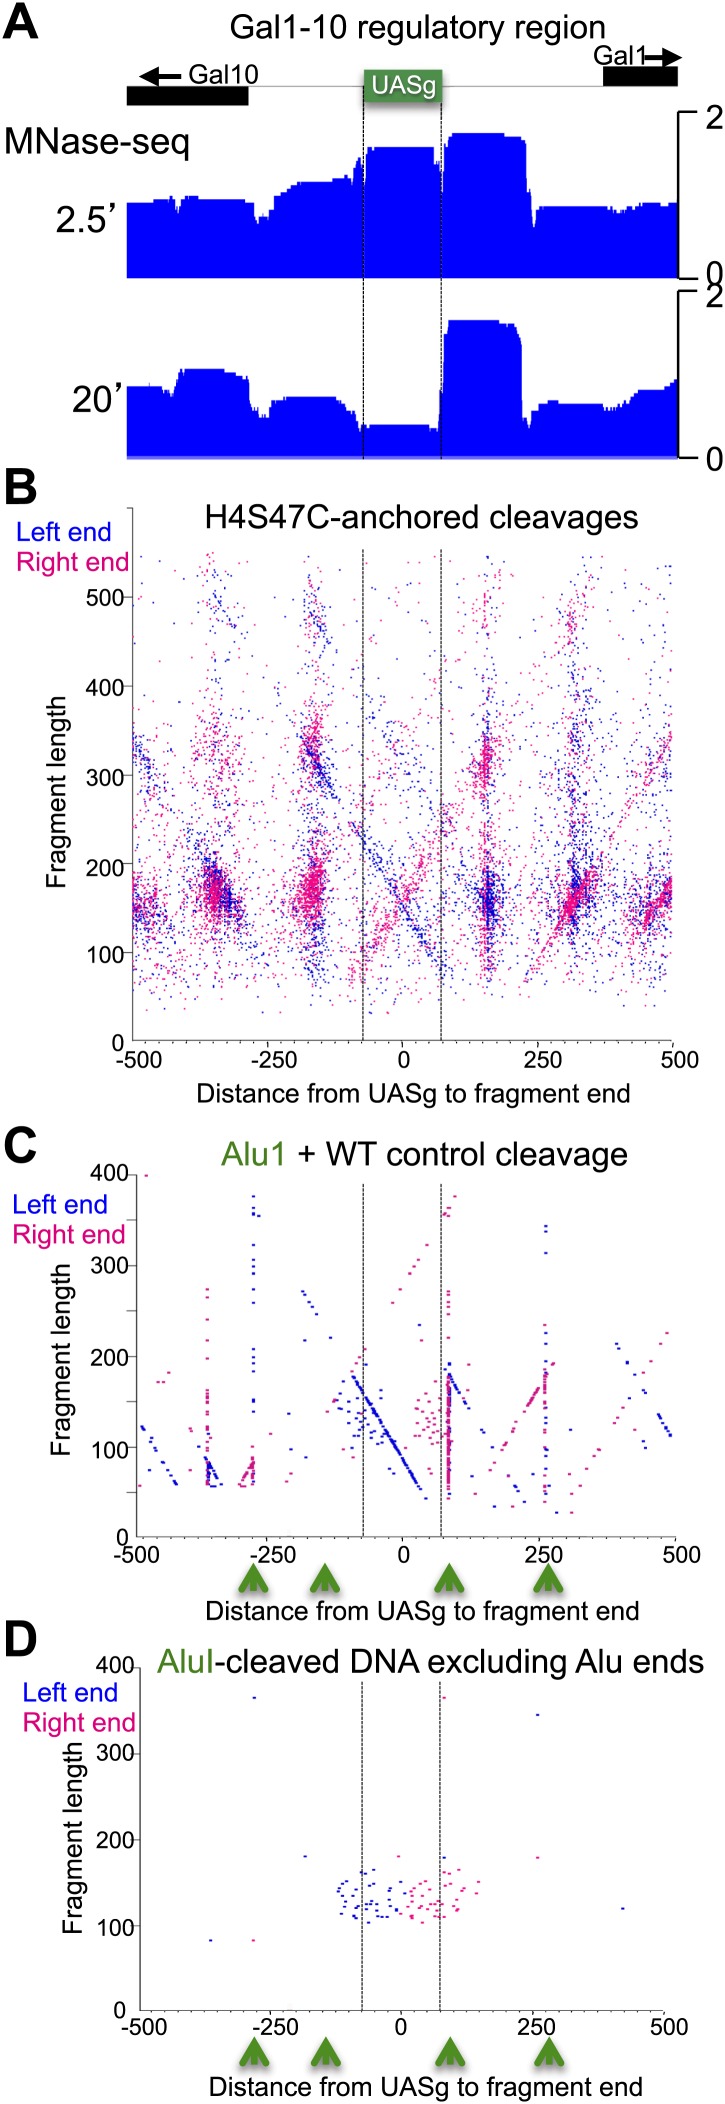
Figure 7—figure supplement 3. The fragile nucleosome over the Gal1-10 UASg is not detected by H4S47C-anchored cleavage mapping.

Figure 7—figure supplement 3.

(A) MNase-seq normalized count data from stacked paired-end reads showing that the nucleosome over the UASg is present at high occupancy after 2.5 min MNase digestion, but is strongly depleted after 20 min digestion (Bartfai et al., 2010). (B) Left-right V-plot of the same region showing H4S47C-anchored cleavages, where the dotted lines indicate the UASg. (C) Same as (B), except that labeling and cleavage reactions were performed using a wild-type strain, and DNA was cleaved to completion with AluI after purification. Green arrows indicate the location of AluI sites. The high density of dots on the diagonal over the UASg confirms that cleavages seen over the UASg in the H4S47C-anchored strain reflect background cleavages in a nucleosome depleted region. (D) V-plot diagonals are not seen in DNA from untreated cells. DNA was purified directly from cells subjected to immediate alkaline lysis and cleaved with AluI prior to library construction. Points that fell between −2 and +2 bp relative to the AluI cleavage position were excluded for clarity as these most likely represent AluI cleavages and occasional imperfect end-polishing. Green arrows indicate the location of AluI sites. These background cleavages would appear to have occurred in vivo.
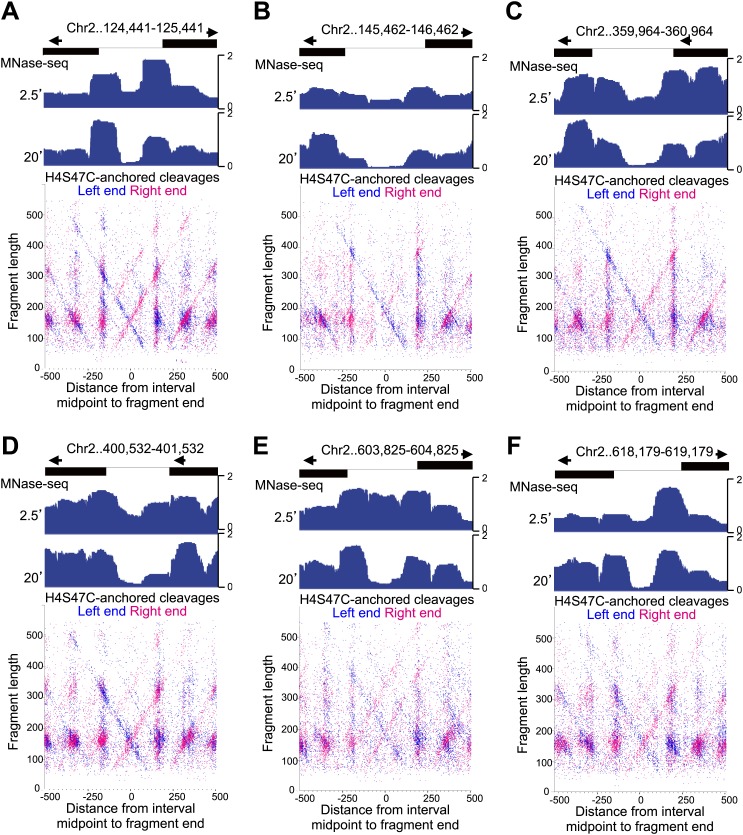
Figure 7—figure supplement 4. Fragile nucleosome are not detected by H4S47C-anchored cleavage mapping.

Figure 7—figure supplement 4.

See the legend to Figure 7—figure supplement 4. (A-F) Examples from Chromosome 2 are shown in which nucleosome-sized fragments (>140 bp) displayed fragility as defined by a conspicuous drop in occupancy during MNase digestion relative to well-phased nucleosomes on either side (Codomo et al., 2014). Unlike the Gal4 UAS, which has a high G+C content and so is inherently resistant to MNase digestion (Chung et al., 2010), the G+C content of each fragile nucleosome is near average or low relative to the entire genome.
Figure 7—figure supplement 5. Nucleosome-depleted regions show preferential background cleavages.

Figure 7—figure supplement 5.

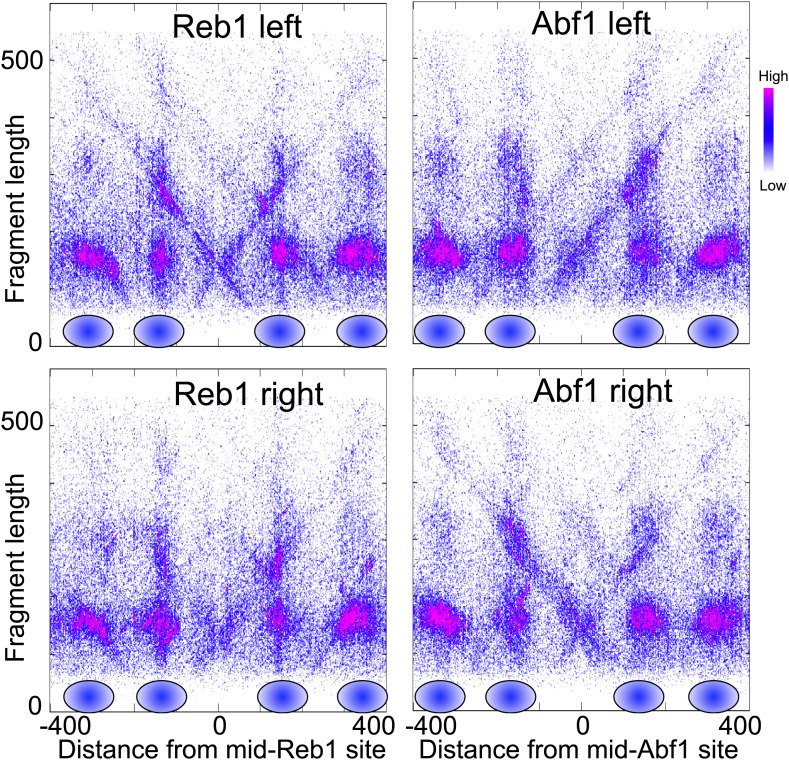
Density left-right V-plots for pooled left and right ends of H4S47C-anchored cleavages over aligned binding sites of Reb1 (left) and Abf1 (right), transcription factors that strongly phase nucleosomes on either side (Bartfai et al., 2010).