

Abstract
LPS is a major component of the outer membrane of Gram-negative bacteria. The lipid A region of LPS mediates stimulation of the immune system. In E. coli, the gene (formerly htrB) codes for a late lauroyltransferase (LpxL) in lipid A biosynthesis. E. coli lpxL mutants have been described previously with impaired growth above 33°C in rich media. However, we were able to grow lpxL mutants at 30°C, 37°C and 42°C, and investigate their lipid A moieties to gain insight into changes and regulatory effects in lipid A biosynthesis. Multiple-stage mass spectrometry was used to decipher unusual lipid A structures produced by lpxL mutant bacteria at high temperatures that rescue the temperature-sensitive phenotype. At 37°C and 42°C, E. coli lpxL mutants appear to activate different acyltransferases or biosynthetic pathways that generate atypical penta- and hexaacyl lipid A structures by incorporating longer fatty acids, such as a secondary palmitoleic acid (2′-O-position, distal) and a secondary palmitic acid (2-O-position, proximal) respectively. However, we observed no changes in these structures through various growth curve stages. This study indicates that E. coli (lpxL) lipid A biosynthesis, and specifically the ‘late’ acylation of lipid A, is temperature dependent, thus suggesting a highly regulated process.
Keywords: Late acylation, lipopolysaccharide, lpxL, mass spectrometry, temperature regulation
Introduction
Escherichia coli LPS complexes with MD-2 to interact with TLR4 on macrophages and endothelial cells, and functions as a pro-inflammatory endotoxin, eliciting the release of inflammation mediators (TNF-α, IL-1β) and co-stimulatory molecules required for the adaptive immune response.1 Lipid A moieties play an important role as they serve as a hydrophobic anchor of the bacterial outer membrane LPS. The biological activity of lipid A is affected by the degree of acylation, and the most potent form of E. coli lipid A is hexaacylated and phosphorylated at the 4′ and 1 positions of a diglucosamine backbone.2 E. coli lipid A biosynthesis has been studied extensively and is composed of several key steps. Briefly, a basic tetraacyl lipid A commonly referred to as lipid IVA is made first, containing four primary 3-hydroxymyristic acids, 14:0(3-OH), attached to the diglucosamine backbone (see Supplementary Figure S1). Next, late acyltransferase enzymes LpxL and LpxM sequentially add the fifth and sixth fatty acids to the lipid IVA precursor (tetraacyl lipid A) after glycosylation with two 3-deoxy-D-manno-oct-2-ulosonic acid (Kdo) sugars.3,4 Specifically, the E. coli laurate transferase LpxL, encoded by lpxL (formerly htrB), acylates (Kdo)2-lipid IVA, adds a secondary lauric acid to the 3-hydroxymyristic acid at the 2′ position of the distal glucosamine.3,5,6 As expected, at 30°C lpxL mutants lacking the laurate transferase LpxL predominantly generate penta- and tetraacylated lipid A species.7
It has been reported previously that E. coli lpxL mutants show impaired growth above 33°C in rich media.3,5,6 In this study, lpxL mutants were grown at 30°C, as well as at 37°C and 42°C, well above conditions shown to impair growth. Furthermore, we carried out a systematic investigation of lipid A structures obtained from E. coli lpxL mutant strains grown at these three temperatures to gain insight into high temperature- dependent changes and regulatory effects on lipid A biosynthesis. We used multi-stage mass spectrometry (MSn) to monitor structural changes of lpxL mutant lipid A in relation to high temperatures and to determine their unusual acylation states. MSn fragmentation methodologies have proven as effective tools to investigate diverse bacterial lipid A structures and decipher fatty acid positions and changes.8–10 The goal of this study is to provide additional insight into the specificity and regulation of the late acyl transferase LpxL. Of particular interest is the relevance of LpxL in bacterial growth at higher temperatures and alternative lipid A structures that lpxL mutant strains synthesize in order to survive and grow under these more extreme conditions.
Materials and methods
Bacteria culture conditions and LPS isolation
E. coli K-12 wild type (W3110) and lpxL mutant strains (MLK217) were plated from freezer stocks and incubated at 30°C for 20 h on Lauria–Bertani (LB) plates. Ten milliliters of LB broth cultures were prepared from these plates and grown at 30°C for 4 h and used as 1:25 inocula into 100 ml LB medium in nephlometry flasks for 24 h at 30°C, 37°C and 42°C. Absorbance at 600nm was recorded every 2–3 h using a Spectronic 20 GynSys instrument. Bacteria were harvested and LPS was isolated as previously reported by McLendon et al.7 Time points for the mass spectrometric time course were selected based on the acquired growth curves (shown in Figure 1). Time points at 37°C and 42°C were chosen at 4, 6, 14 and 24 h, as the lpxL mutant strain MLK217 initially grew extremely slowly at 42°C and remained in the lag phase for 12 h; then, however, the lpxL mutant strain grew exponentially (between 12 and 15 h) before reaching levels approaching that obtained by the wild type strain W3110 in its stationary growth phase at 24 h (see Figure 1).
Figure 1.
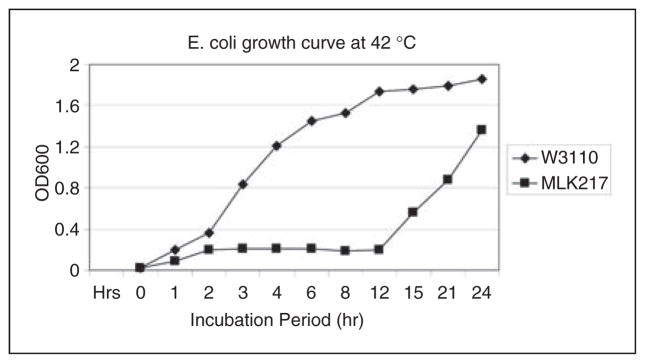
Escherichia coli K-12 wild type (W3110) versus lpxL mutant (MLK217) growth curve at 42°C. OD600 was measured over a period of 24 h. lpxL mutant strain MLK217, lacking a laurate- transferase, showed an extended lag-phase and very slow initial growth. At 12–15 h, MLK217 began to grow exponentially reaching levels near that of the wild type strain W3110. Samples were taken every 4–6 h, LPS was isolated and hydrolyzed to obtain lipid A, which was subsequently analyzed by MALDI–MSn.
RNA isolation
Overnight plate cultures were used to create cell suspensions of E. coli W3110 and MLK217 for inoculation of 5 ml of LB broth. Cultures were shaken for 3, 6, and 18 h at 30°C and 37°C. Cells were centrifuged at 1430 g for 15 min and reconstituted with 1 ml of TRIZOL Total RNA Isolation Reagent (Life Technologies, Grand Island, NY, USA). Lysates were transferred to Lysing matrix B tubes (MP Biomedicals, Santa Ana, CA, USA) and vortexed for 60 s. The lysates were extracted with 200μl of chloroform and centrifuged for 15 min. The supernatant was precipitated with 1 volume of isopropanol for 10 min at 25°C (room temperature). RNA was pelleted and washed with 75% ethanol, and the pellet was dried at room temperature. RNA was reconstituted in UltraPure water and cleaned with a Qiagen RNeasy Mini kit (Valencia, CA, USA). The RNA was then treated with TURBO DNA-free (Life Technologies) for 30 min at 37°C and purified using a phenol:chloroform:isoamyl alcohol (25:24:1; Roche, Indianapolis, IN, USA) extraction followed by an ethanol precipitation. RNA purity was assessed on an Agilent 2100 bioanalyzer (Santa Clara, CA, USA).
Quantitative real-time PCR
Gene expression was examined using TaqMan quantitative real-time PCR (qRT-PCR).11 For each gene, TaqMan primer/probe sets (Supplementary Table S1) were designed using Primer Express software (Life Technologies) and obtained from Life Technologies. Twenty-milliliter reactions were set up in triplicate containing 1×TaqMan One-Step RT-PCR master mix (Life Technologies), 10 ng RNA template or genomic DNA standard, and a 1×final concentration of each primer/probe set. RT-PCR was performed on an ABI Prism 7900 sequence detection system (Life Technologies). Relative RNA quantities were determined with a standard curve of purified genomic DNA ranging from 100 ng/μl to 0.00032 ng/μl; all values were normalized to the amount of 16 S ribosomal RNA (rrsA) in each sample. Correlation coefficients for the slopes of these studies all exceeded 0.99.
Acid hydrolysis of LPS–lipid A preparation
To prepare lipid A, between 0.1 and 1 mg of partially purified LPS isolated from wild type W3110 and lpxL mutant MLK217 strains were hydrolyzed in 200 μl 1% acetic acid at 100°C for 1–2 h. Samples were centrifuged at 4°C for 40 min, and the pellets, containing lipid A, were washed twice with water and dried under a stream of nitrogen. For further purification, the lipid A pellets were partitioned in 525 μl CHCl3/CH3OH/H2O (10/5/6, v/v/v) and the bottom organic layers and interfaces were saved and evaporated to dryness under a stream of nitrogen.
Lipid A analysis and MSn
Lipid A samples were first dissolved in 3:1 CHCl3/ CH3OH (v/v); l μl of analyte was then mixed with l μl saturated matrix solution (6-chloro-3-mercaptobenzothiazole) in 3:1 CHCl3/CH3OH (v/v), and spotted on 96 - or 384-position stainless steel matrix-assisted laser desorption/ionization (MALDI) target plates. Spectra were acquired in the negative ion mode using XCalibur 2.2 software scanning a mass range from m/z 700 to 4000 (in MS mode) on a LTQ linear ion trap fitted to an intermediate vacuum MALDI ion source (Thermo Fisher, San Jose, CA, USA). The intermediate vacuum (170 mTorr) MALDI ion source uses a 337.7nm SI nitrogen laser with a frequency of 20 Hz and energy of 250 μJ per pulse. All masses reported correspond to monoisotopic masses. To record MSn (n=2–7) the following parameters were used: precursor ion isolation width of 3 u, normalized collision energy of 40% (radio frequency (RF) amplitude in percent used to fragment ions), activation Q of 0.25 and activation time of 30 ms. Spectra were recorded using automatic gain control to control the number of laser shots.
Results and discussion
Growth curves of wild type and lpxL mutant strains
E. coli wild type and lpxL mutant strains were first cultured at high temperatures (37°and 42°C) and their growth curves monitored. As shown in Figure 1, when grown at 42°C the wild type strain W3110 showed a typical growth curve, with a short lag phase (0–2 h), a log phase where major bacterial growth occurred (2–12 h), followed by a plateaued stationary phase (12–24 h). In contrast, the lpxL mutant strain MLK217 initially grew extremely slow at 42°C and remained in the lag phase for 12 h. However, between 12 and 15 h, the lpxL mutant strain MLK217 grew exponentially before reaching levels approaching that obtained by the wild type strain W3110 in its stationary growth phase at 24 h.
Our studies utilized the strains originally constructed by Karow et al.12 These investigators used insertional mutagenesis with mini-Tn10 to generate their mutants. In the lpxL (htrB) mutant, the insertion was 536 bp downstream of the transcriptional start site, allowing us to measure the effect of changes in different temperatures and growth phase on gene expression as a function of stress by utilizing primers initiating at 417 bp from the transcriptional start and terminating at 470 bp downstream. The stress caused by the mutation in the lpxL gene induced changes in gene expression to compensate for the loss of the acyl chain structure in the lipid A. Analysis of lpxL expression at 30°C and 37°C was performed using qRT-PCR, and indicated that this was increased approximately sixfold at the early- and mid-log phase of growth (3 and 6 h). After 18 h, lpxL gene expression returned to wild type levels (Figure 2).
Figure 2.
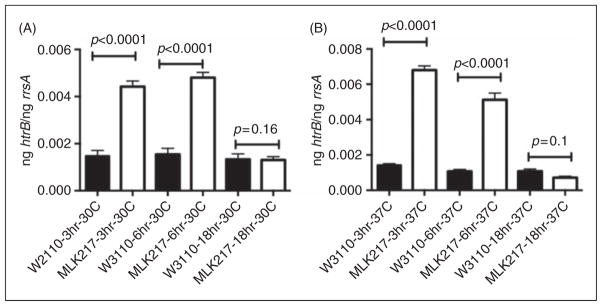
qRT-PCR analysis of the changes in expression of lpxL (MLK217) in comparison with wild type (W3110) over the period of growth described in Figure 1. Comparison has been made with the expression of the ribosomal gene rrsA, which is constitutively expressed. As can be seen, at 3 and 6 h expression of lpxL is sixfold greater in the mutant than the parent strain. At 18 h, the expression of both mutant and wild type strain are essentially identical.
E. coli is able to grow over a temperature range of 10–49°C. This occurs because of its ability to adapt by changing a broad array of factors associated with metabolism and cell wall structure.13 In a series of papers, Karow and co-workers,5,6,12,14,15 using transposon mutagenesis, constructed a set of mutations in the htr (high temperature requirement) genes, which affect the ability of the organism to grow normally at temperatures above 33°C. Studies in our laboratory demonstrated previously that LpxL (or formerly HtrB) is a Kdo-dependent acyltransferase.16,17 The stress impact on the bacteria by this mutation results in changes in acyltransferase gene expression. This is reflected in the analysis of the lpxL gene expression, which demonstrated a sixfold increase in expression of the mutant compared with the parent strain at early- and mid-log phases, indicative of the stress imposed by the mutation. By the lag phase of growth, the level of gene expression was similar commensurate with the reduction in bacterial growth.
Lipid A profiles analysis
To address how lipid A changes with respect to elevated temperature, we characterized the structures of lipids A isolated at various temperature and time points by mass spectrometry. E. coli wild type and lpxL mutant samples were collected every 4–6 h, and LPS was isolated and hydrolyzed to obtain a lipid A preparation. A MALDI–MSn strategy was then employed, which we originally developed to interrogate the amide- and ester-linked acyl chains patterns in lipid A species isolated from the LPS of Francisella and complemented E. coli species.7,8 Mass spectra obtained from the lipid A species isolated after 14 h from E. coli wild type strain W3110 grown at 37°C and 42°C were found to be consistent with the lipid A structures previously reported for E. coli K-12 strains grown under lower temperature conditions (30°C).18 Briefly, as shown in Supplementary Figure S2, two abundant deprotonated molecular ions (M-H)− were observed at m/z 1796.1 and 1716.0, which correspond to di- and mono-phosphoryl hexaacylated lipid A species (MPLA6 and DPLA6 respectively), containing four 3-hydroxymyristic acids, 1 myristic acid (14:0) and 1 lauric acid (12:0). In addition, less abundant peaks were assigned to penta-, tetra- and triacyl lipid A species, some of which are likely formed by partial acid-catalyzed O-deacylation during acetic acid treatment of LPS. Moreover, no changes in growth rates or in the corresponding lipid A profiles were observed at these higher growth temperatures. In contrast, high temperatures clearly affected both the growth and the lipid A profiles of the lpxL mutant strain as seen in Figure 1 and their MALDI–MS profiles (see Figure 3).
Figure 3.

Negative-ion MALDI–MS mass spectra profiles of lipid A preparations. Lipid A was isolated from E. coli lpxL mutant strain MLK217 grown (A) at 30°C, (B) at 37°C and (C) at 42°C after 14 h growth. Earlier reports showed that E. coli lpxL mutant strain MLK217 lacks a lauric acid (12:0 fatty acid, ΔM=−182 u) that was located at the secondary 2′-O-position of an acyloxy bond to the primary O-linked 3-hydroxymyristic acid located on the distal glycosamine in the 3′-position in the corresponding wild type strain. Lipid A mass peaks of the lpxL mutant strain are annotated with the assigned composition of fatty acids. Lipid A acylation patterns and acyl group compositions vary significantly with temperature. The lipid A species at m/z 1541.8 (B, annotated with #) corresponds to an anhydro lipid A species, i.e. 4×14:0(3-OH), 16:1, –H2O.
E. coli lpxL mutant strains lack a lauric acid in their lipid A structure, as noted previously by Karow et al.6 Figure 3 shows MALDI–MS spectra of lipid A obtained from E. coli lpxL mutant strain MLK217 grown at 30°C, 37°C and 42°C for 14 h, corresponding with the exponential growth phase. At 30°C growth conditions (Figure 3A), MALDI–MS profiles of the lipid A preparations from the lpxL mutant showed deprotonated molecular ions (M-H)−, corresponding to the major lipid A components that were 182 u lower in mass compared with the wild type strain. These masses correspond to the expected, established pentaacyl species at m/z 1533.9 (MPLA5) and 1613.9 (DPLA5), consisting of four 3-hydroxymyristic acids and 1 myristic acid located at the secondary 3′-O-position of the distal glucosamine (for structural display see Supplementary Figure S3). In addition, tetraacyl species were observed at m/z 1323.8 (MPLA4) and 1403.8 (DPLA4), consisting of four 3-hydroxymyristic acids. These data were consistent with an earlier study where we used mass spectrometry to characterize the lipid A in an E. coli lpxL mutant strain grown at low temperature (30°C) as part of a study to identify the corresponding lpxL gene in Francisella tularensis.7
However, unlike previous reports, we were able to successfully grow the lpxL mutant strain at higher temperatures, allowing, for the first time, the ability to assess the high-temperature dependence of lipid A acylation status. As shown in Figure 3B, the lipid A profile obtained at 37°C shows the emergence of a major pentaacyl species at m/z 1559.8 (MPLA5), consisting of four 3-hydroxymyristic acids and 1 palmitoleic acid (16:1), the latter acyl group of which was shown by MSn to be at the secondary 2′-O-position of the distal glucosamine (see also Figure 5; MSn details described below). A related pentaacyl lipid A species was also detected 18 u lower in mass at m/z 1541.8, and corresponded with the analogous anhydro form. In addition, the corresponding and abundant hexaacyl species was observed at m/z 1769.8 with an additional myristic acid in the secondary 3′-O-position and the palmitoleic acid in the secondary 2′-O-position, where the precise acylation patterns had been previously determined by our group.7 It should be noted that this same hexaacyl species was detectable at lower abundance when growth was at 30°C (compare Figure 3A with 3B).
Figure 5.

Negative-ion MALDI–linear ion trap (LIT) MSn spectra of pentaacyl lipid A from E. coli mutant strain MLK217 (lpxL) grown at 37°C. MSn spectra of pentaacyl lipid A species at m/z 1559.8 [4×14:0(3-OH), 16:1] with the palmitoleic acid in the distal secondary 2′-O-position; (A) MS/MS of m/z 1559.8; (B) MS3 of m/z 1315.6; (C) MS4 of m/z 1071.6; and (D) MS5 of m/z 744.4. Additional MSn spectra of this lipid A species are provided in Supplementary Figure S5.
The lipid A pattern and fatty acid composition changed yet again in the lpxL mutant strain when the growth temperature was further elevated to 42°C (Figure 3C). The lipid A profile showed a more abundant tetraacyl species at m/z 1323.6, as well as a novel pentaacyl species at m/z 1561.8. At this higher temperature, the tetraacyl lipid A species, whose structure was found to contain four 3-hydroxymyristic acids, was the most abundant species. The pentaacyl lipid A also contained four 3-hydroxymyristic acids, as well as an additional palmitic acid (16:0), the latter present at the secondary 2-O-position of the proximal glucosamine (also see Figure 6; MSn details described below). The corresponding, but now barely detectable, hexaacyl species at m/z 1772.0 contained an additional myristic acid moiety, and also showed the palmitic acid to be located at the secondary 2-O-position (Supplementary Figure S3; details below). All lpxL mutant strain lipid A species shown in Figures 3A–C were annotated with the assigned composition of fatty acids and listed in Table 1. As will be described in detail below and as is summarized in Table 1, all lipid A structures that were identified under the different temperature growth conditions underwent comprehensive analysis using MSn, which allowed us to determine the precise locations of the fatty acids on the conserved diglucosamine backbone. An overview of the observed lipid A structures from the lpxL mutant and their associated temperature dependence is summarized in Supplementary Figure S3. In accordance with this current study, an E. coli palmitoleoyltransferase and a secondary palmitoleic acid lipid A substitution in 2′-O-position (distal glucosamine) were described previously. 7,19 It should also be mentioned that there is precedence for lipid A structures that contain a palmitic acid, as previously reported by Sunshine et al.20 where a lipid A structure in Salmonella typhimurium was characterized with a palmitic acid in the secondary 2-O-position.
Figure 6.

Negative-ion MALDI–MSn spectra of pentaacyl lipid A from E. coli mutant strain MLK217 (lpxL) grown at 42°C. MSn spectra of pentaacyl lipid A species at m/z 1561.9 [4×14:0(3-OH), 16:0] with the palmitic acid in 2-O-position of the proximal glucosamine; (A) MS/MS of m/z 1561.9; (B) MS3 of m/z 1317.8; (C) MS4 of m/z 1073.7; and (D) MS5 of m/z 817.3. Additional MSn spectra of this lipid A are provided in Supplementary Figure S6.
Table 1.
Temperature dependence of lipid A structures in E. coli lpxL MLK217 determined by MALDI-MSn.
| MS species | Mr obs. (exact) | Mr calc. (exact) | MSn analysis | Lipid A structurea (acyl group composition and positions) | Temperature (°C)
|
||
|---|---|---|---|---|---|---|---|
| 30 | 37 | 42 | |||||
| Pentaacyl lipid A | |||||||
| MPLA 5 | 1534.8 | 1535.1 | MS6 | 4×14:0(3-OH)[2′, 3′, 2, 3], 14:0 [3′-O], P | +++ | +++ | ++ |
| MPLA 5 | 1560.8 | 1561.1 | MS6 | 4×14:0(3-OH)[2′, 3′, 2, 3], 16:1 [2′-O], P | + | +++ | — |
| MPLA 5 | 1562.8 | 1563.1 | MS6 | 4×14:0(3-OH)[2′, 3′, 2, 3], 16:0 [2-O], P | + | — | +++ |
| MPLA 5 | 1542.8 | 1543.1 | MS5 | 4×14:0(3-OH)[2′, 2, 3′, 3], 16:1 [2′-O], P, –H2O | — | ++ | — |
| Hexaacyl lipid A | |||||||
| MPLA 6 | 1770.8b | 1771.4 | MS7 | 4×14:0(3-OH)[2′, 3′, 2, 3], 14:0 [3′-O], 16:1 [2′-O], P | ++ | +++ | — |
| MPLA 6 | 1773.0 | 1773.4 | MS6 | 4×14:0(3-OH)[2′, 3′, 2, 3], 14:0 [3′-O], 16:0 [2-O], P | — | — | + |
| MPLA 6 | 1742.8c | 1743.3 | MS6 | 4×14:0(3-OH)[2′, 3′, 2, 3], 12:0 [3’-O], 16:1 [2′-O], P; 4×14:0(3-OH)[2′, 3′, 2, 3], 14:0 [3′-O], 14:1 [2′-O], P (mix) | (+) | + | — |
| Tetraacyl lipid A | |||||||
| MPLA 4 | 1324.7 | 1324.9 | MS5 | 4×14:0(3-OH)[2′, 3′, 2, 3], P | +++ | +++ | +++ |
| MPLA 4 | 1334.7 | 1334.9 | MS5 | 3×14:0(3-OH)[2′, 2, 3], 16:1 [2′-O], P | — | ++ | — |
| MPLA 4 | 1336.7 | 1336.9 | MS5 | 3×14:0(3-OH)[2′, 2, 3], 16:0 [2-O], P | — | — | + |
Position of acyl group on the disaccharide lipid backbone is indicated for primary 3-hydroxyacyl fatty acids [n:0(3-OH)] as 2′ (N-linked), and 3′ (O-linked) when located on the distal glucosamine, and as 2 (N-linked), and 3 (O-linked) when located on the reducing end of the proximal glucosamine. Positions for observed secondary acyl groups [n:0 or n:1] are indicated as [3′-O], [2-O], and [2′-O]. Secondary acyl groups are connected to the 3-hydroxy group of the corresponding primary fatty acid.
Previously characterized by McLendon et al.7
Lipid A species appear as isomer mixtures displaying different fatty acid positioning on the disaccharide lipid backbone (compositions are indicated). If no mixture is indicated, the lipid A species were observed as single isoform. All masses reported are monoisotopic masses M. Lipid A species were observed in negative ionization mode with their deprotonated molecular ion, [M-H]−, and were confirmed by MSn fragmentation on a vMALDI MSn LIT instrument as annotated.
In addition to identifying the major structures of the lpxL mutant at a single 14 h time point, we also examined how these lipid A species changed over the course of the 24 h growth period. While Figure 3 shows data from a single time point at 14 h, mass spectra were also obtained at several earlier and later time points, including 4, 6 and 24 h (see Supplementary Figures S4A–C), as well as at three temperatures, i.e. 30°C, 37°C and 42°C. Perhaps surprisingly, no significant changes in either the lipid A structural compositions and/or relative molecular ion abundances were observed for the different time points at a given, constant temperature.
However, the presence of lipid A with varying degrees of acylation (tetra- to hexaacyl species) and fatty acid compositions at the different temperatures of lpxL mutant appeared to be regulated. To further confirm structural assignments lipid A species were recorded at higher mass resolution (UltraZoom mode). As shown in Figure 4, lipid A species recorded at higher mass resolution revealed details of the lipid A isotope pattern that, under close inspection, supported the presence of distinct lipid A structures containing palmitoleic acid and/or a palmitic acid (2 u mass difference). Figure 4A displays the lpxL mutant strain MLK217 grown at 37°C and shows a major isotope pattern for a pentaacyl species at m/z 1559.9. In-depth MSn analysis subsequently determined the palmitoleic acid to be located on the secondary 2′-O-position of the distal glucosamine (see Figure 5). In contrast, as shown in Figure 4B, when grown at 42°C the dominant mass of the pentaacyl species shifted up by 2 u to m/z 1561.9, consistent with a saturated palmitic acid now in the secondary 2-O-position of the proximal glucosamine (see Figure 6). Theoretical isotopic distributions for these lipid A species (data not shown) simulated using the MS Isotope program (http://prospector.ucsf.edu) showed close agreement with the experimental data. Similarly, Figures 4C and 4D show mass spectra of the corresponding hexaacyl lipid A species at both 37°C and 42°C, which contained either palmitoleic acid or palmitic acid, and were also assigned by MSn analysis to the distal and proximal (2′-O- and 2-O-positions), respectively, as described below.
Figure 4.

Negative-ion MALDI–MS spectra of distinct lipid A species recorded at higher resolution in the UltraZoom mode. (A) E. coli lpxL strain MLK217 grown at 37°C showed an isotope pattern consistent with a monophosphoryl pentaacyl species at m/z 1559.9, which corresponds to an acyl composition of four 3-hydroxymyristic acids and 1 palmitoleic acid in the distal secondary 2′-O-position. (B) E. coli lpxL strain MLK217 grown at 42°C contains an isotope pattern for a pentaacyl species 2 u higher at m/z 1561.9, which corresponds to a fatty acid composition of four 3-hydroxymyristic acids and one palmitic acid at the proximal secondary 2-O-position. (C) and (D) show corresponding hexaacyl lipid A species at 37°C and 42°C, respectively (C) At 37°C the lpxL mutant hexaacyl lipid A with palmitoleic acid at the distal secondary 2′-O-position is a prominent species. (D) at 42°C different hexaacyl species with palmitic acid at the proximal secondary 2-O-position are produced. In all cases, the precise positions of the fatty acids shown in this figure were determined by MSn analysis, as described in the text and accompanying supplementary material.
Multistage MS analysis of lipid A species
As indicated in the previous section, we carried out a set of MSn fragmentation studies to elucidate the structures of some of these novel lipid A species, especially those containing the longer fatty acids, such as palmitoleic acid and palmitic acid. In a previous study, our group determined the precise fatty acid substitution pattern for a low abundance hexaacyl lipid A species form a lpxL mutant strain containing a palmitoleic acid grown at 30°C using a similar MSn approach.7 Here, we employed MALDI–MSn to determine the acyl substitution patterns of the novel mono-phosphoryl pentaacyl lipid A species at m/z 1559.8 isolated from an lpxL mutant strain MLK217 grown at 37°C. These data confirmed a fatty acid composition of four 3-hydroxymyristic acids with a palmitoleic acid (236 u) added to the 3-hydroxymyristic acid at the 2′ position of the distal glucosamine, as suggested above. Figure 5A shows the MALDI–MS2 of this mono-phosphoryl pentaacyl lipid A with the precursor ion selected at m/z 1559.8, yielding fragment ions that represent both single- and multiple-bond cleavages. Acyl cleavage patterns are annotated with letters ‘a’ to ‘g’ within the spectra, indicating specific positions of acyl chain losses or cross-ring cleavages. The major fragment ions at m/z 1315.6 and a secondary, less abundant fragment ion at m/z 1071.6 could be assigned as originating from a single- and two-bond cleavage involving the loss of 1 and 2 O-linked 3-hydroxymyristic acids (−244 u) from the precursor ion respectively (cleavages ‘c’ and ‘d’, diglucosamine backbone at positions 3 and 3′). The MS2 spectrum also revealed a smaller peak at m/z 1274.6 that arose from a cross-ring cleavage (annotated as cleavage ‘g’, −285 u)—an 0,2A2-type fragmentation according to the nomenclature of Costello and Vath.21
To confirm the locations of the fatty acids on the diglucosamine backbone, the major MS2 fragment ion at m/z 1315.7 was selected, yielding the MALDI–MS3 spectrum shown in Figure 5B. Subsequently, the major MS3 fragment at m/z 1071.6 corresponding to the loss of the second O-linked 3-hydroxymyristic acid (−244 u) was selected, and the resulting MS4 spectrum is shown in Figure 5C. In this MS4 spectrum an abundant fragment at m/z 744.4 is present that can be assigned to an 0,4A2-type cross-ring cleavage (−327 u, cleavage ‘f’), which can only be generated if the secondary palmitoleic fatty acid is linked to a 3-hydroxymyristic acyloxy group in the distal 2′ position of the diglucosamine backbone as opposed to the proximal 2 position. Additional fragments were observed at m/z 828.4 owing to a loss of N-linked 3-hydroxymyristic acid (−243 u, cleavage ‘e’, diglucosamine backbone position 2), and at m/z 817.4 resulting from a loss of the secondary palmitoleic fatty acid that was O-linked to the 3-hydroxymyristic acyloxyacyl group in the 2′ position of the diglucosamine backbone (−254 u, cleavage ‘a’). Further proof of the location of the secondary 16:1 fatty acid in 2′-O-position (on the distal glucosamine) was obtained from the MS5 spectrum generated from the precursor ion at m/z 744.4, as shown in Figure 5D. Here, the most abundant fragment ion was m/z 490.2, and could only result from a loss of the secondary palmitoleic fatty acid in the 2′-O-position. For completion, additional fragmentation experiments were performed as summarized in Supplementary Figure S5.
While the data presented demonstrated the presence of a secondary palmitoleic acid located in the 2′-O-position on the distal glucosamine of the pentaacyl lipid A isolated from the lpxL mutant at 37°C, the position of a secondary palmitic acid in this strain grown at 42°C was as yet unassigned. Figure 6A shows the MALDI-MS2 of this pentaacyl lipidAat m/z 1561.9 that yielded an abundant fragment ion at m/z 1317.8, consistent with a loss of 1 O-linked 3-hydroxymyristic acid (−244 u). Subsequent acyl group losses from this latter fragment ion yielded two-bond cleavage fragments at m/z 1073.6 (loss of the second O-linked 3-hydroxymyristic acid) and m/z 1061.5 (additional loss of palmitic acid, −256 u, as a b′-type cleavage product). The MS2 fragment at m/z 1038.5 could be assigned as an 0,2A2-type cross-ring cleavage (annotated as ‘g’, −523 u), consistent with the palmitic acid linked to the 3-hydroxymyristic acid at the 2-position on the proximal glucosamine, and the resulting combined loss of those latter connected acyl groups as part of the 0,2A2-type cross-ring cleavage.
Further multiple stage fragmentation selected precursor ions at m/z 1317.8 (MS3, Figure 6B) and m/z 1073.7 (MS4, Figure 6C). It should be noted that the precursor ion at m/z 1073.7 selected in the MS4 scan showed a prominent loss of the palmitic acid (‘b’-type cleavage) that was linked to the 3-hydroxymyristic acid at the 2-position of the diglucosamine backbone. Subsequently, the fragment ion at m/z 817.3 yielded an 0,4A2-type cross-ring cleavage product (−309 u, ‘f’-type cleavage). To produce this 309 u loss the latter 0,4A2-type cleavage required that the proximal glucosamine contained a Δ2-14:1 acyl group that was formed in an earlier fragmentation step from the elimination of palmitic acid from 3-hydroxymyristic acid. A similar process was observed in the MS5 spectrum of m/z 817.3 (Figure 6D) that yielded a fragment ion at m/z 508.3 (0,4A2-type crossring cleavage, –309 u). The MS5 spectrum of m/z 817.3 (see Figure 6D) also produced a fragment ion at m/z 592.2 that could be assigned as originating from a loss of an N-linked Δ2-14:1 acyl group (−225 u) that itself was a product from the earlier elimination of an O-linked palmitic acid. Further fragmentation spectra are shown in Supplementary Figure S6, and were all consistent with the assigned lipid A structure with the secondary palmitic acid located in 2-O-position on the proximal glucosamine.
Lastly, the corresponding hexaacyl lipid A species isolated from the lpxL mutant strain grown at 42°C was subjected to MSn analysis. The lipid A species at m/z 1772.2 consisted of four 3-hydroxymyristic acids, a myristic acid and an additional palmitic acid (see Figure 7). The resulting MSn data confirmed that the palmitic acid was located on the 2-O-position of the proximal glucosamine. For the hexaacyl lipid A species at m/z 1772.2 (see Figure 7) similar general fragmentation patterns were observed and compared with the corresponding palmitic acid-containing pentaacyl lipid A species at m/z 1561.9 (see Figure 6). Figures 7A–D show the hexaacyl MALDI–MSn spectra featuring major losses of a myristic acid (−228 u), loss of an O-linked 3-hydroxymyristic acids (−244 u) and loss of a palmitic acid (−256 u, indicated as a ‘b’-type cleavage product), as well as various cross ring cleavages as already described above. Further fragmentation spectra are shown in Supplementary Figure S7, and were all consistent with the assigned lipid A structure with the secondary palmitic acid located in 2-O-position on the proximal glucosamine.
Figure 7.

Negative-ion MALDI–MSn spectrum of hexaacyl lipid A at m/z 1772.2 from E. coli mutant strain MLK217 (lpxL) grown at 42°C. MSn spectra of hexaacyl lipid A species at m/z 1772.2 [4×14:0(3-OH), 14:0, 16:0] with the palmitic acid [16:0] in 2-O-position (on the proximal glucosamine). (A) MS2 of m/z 1772.2; (B) MS3 of m/z 1543.9 (selected from MS2 1772.2); (C) MS4 of m/z 1299.8 (selected from MS3 1543.9, selected from MS2 1772.2); (D) MS5 of m/z 1073.8 (selected from MS4 of 1299.8, selected from MS3 1543.9, selected from MS2 1772.2). Additional MSn spectra of this lipid A are provided in Supplementary Figure S7.
For completion, a set of MSn spectra of another observed pentaacyl lipid A species at m/z 1533.9 showed it be identical to that observed in lpxL bacteria grown at 30°C and 37°C with a myristic acid in 2′-O-position (on the distal glucosamine; see Supplementary Figure S8). Further lipid A species are displayed in Supplementary Figures S9A–D.
A summary of compositions, acyl group positions and corresponding structures for all lipid A species observed for lpxL mutant strain at the three temperature conditions (30°C, 37°C and 42°C) are shown in Table 1.
Fragmentation pathway analysis of lipid A species
After performing multiple stage MS fragmentation studies on these lipid A species, distinct fragmentation pathways were evident, which allowed for their structural determination. Specifically, these data allowed for the unambiguous assignments of the positions and linkages of various fatty acid on the diglucosamine lipid A backbone. These fragmentation pathways are displayed in Figure 8 and also summarized for several lipid A species investigated in this study in Supplementary Table S2. Various cross-ring cleavages proved especially useful in establishing the precise fatty acid location on the diglucosamine backbone. As shown in Figure 8, the positions of various fatty acid chains could be differentiated for the lipid A species at m/z 1559.8 (Figure 8A) with a composition of four 3-hydroxymyristic acids and a palmitoleic acid. The consecutive MSn fragmentations revealed that the palmitoleic acid must be substituted at the secondary 2′-O-position of an acyloxy bond to the primary N-linked 3-hydroxymyristic acid located on the distal glycosamine in the 2′-position. In contrast, MSn analysis of the lipid A species only 2 u higher at m/z 1561.9 (Figure 8B), which has an identical composition with the exception of a palmitic acid substituting for palmitoleic acid, showed the palmitic acid to be differentially located at the secondary 2-O-position, linked through an acyloxy bond to the primary N-linked 3-hydroxymyristic acid at the 2-position of the proximal glucosamine. These conclusions could be inferred from the 0,2A2-type crossring cleavage present in the spectrum of the lower mass species at m/z 1559.8 (Figure 8A, loss of m/z 285), while the lipid A species at m/z 1561.9 (Figure 8B) yielded an 0,2A2-type cleavage that corresponded to a loss of 523 u owing to the fact that the secondary palmitic acid moiety was connected to the hydroxymyristic acid in 2-position of the proximal glucosamine. Another typical cross-ring fragmentation process, the 0,4A2-type cleavage, also revealed differences depending on fatty acid substitution patterns. For example, the species at m/z 1559.8, following initial precursor ion fragmentation, yields an 0,4A2-type cross-ring cleavage and loss of m/z 327 due to the unmodified hydroxymyristic acid in the 2-position of the proximal glucosamine with a terminal fragment ion at m/z 490 (see Figure 8A). However, the lipid A species at m/z 1561.9 under this same fragmentation regimen produced an 0,4A2-type crossring cleavage with a loss of 309 u due to the Δ2-14:1 fatty acid in the 2-position of the proximal glucosamine, and a terminal fragment ion at m/z 508 (see Figure 8B). The Δ2-14:1 fatty acid itself then provided additional data as to the positional substitution of the secondary O-linked palmitic acid. Additional details of the various fragmentation pathways seen in these MSn studies are available in the Supplementary Table S2.
Figure 8.

Observed characteristic fragment ions of pentaacyl lipid A from E. coli mutant strain MLK217 (lpxL) grown at high temperatures. Different fragmentation pathways and cross-ring cleavage fragment ions are observed depending on the substitution of the diglucosamine lipid A backbone. Two examples are shown for a lipid A species grown at 37°C at m/z 1559.8 with [4×14:0(3-OH), 16:1] (A), and a lipid A species grown at 42°C at m/z 1561.9 with [4×14:0(3-OH), 16:0] (B). (A) Typical fragmentation with an acyl group in the secondary (distal) 2′-O-position, i.e. palmitoleic acid. (B) Fragmentation with an acyl group in (proximal) secondary 2-O-position, i.e. palmitic acid. For further fragmentation pathway details see also Supplementary Table S2.
Conclusions
The detailed investigation of lipid A structures of bacteria grown under high temperature conditions showed that E. coli (lpxL) lipid A biosynthesis, and specifically the ‘late’ acylation of lipid A, is temperature dependent and highly regulated. We previously showed that the lpxL mutant of S. typhimurium undergoes an extended lag phase when grown at high temperatures, but by 24 h reaches approximately 75% of the wild type absorbance at 600 nm and an equal number of colony forming units (CFU).20 Using qRT-PCR we have compared the expression of lpxL in the wild type and mutant, and have shown that loss of a functional lpxL results in significantly higher expression of this gene, which is indicative of a heat stress response most probably mediated by sigmaE. This is also responsible for the fact that at high temperatures, the E. coli lpxL mutant strains appear to activate different acyltransferases or biosynthetic pathways that rescue the temperature- sensitive phenotype by incorporating secondary palmitoleic acid (distal 2′-O-position) and palmitic acid (proximal 2-O-position) respectively. These specific acylation positions were deciphered by interpreting distinct lipid A multiple-stage fragmentation pathways and cross-ring cleavages. A good candidate for eliciting these changes may be pagP, which encodes a palmitoyltransferase.22 In S. typhimurium, it has been shown that this gene is driven by a consensus rpoEp3 promoter.23,24 From this study, one may speculate that the observed lipid A fatty acid heterogeneity and incorporation of longer acyl groups at higher temperatures may have a significant effect on bacterial membrane fluidity that could be beneficial for membrane integrity and bacterial survival. This theory is supported by a previous report by Mejia et al.,25 who investigated the fatty acid profile of E. coli and concluded that the control of membrane fluidity during the heat-shock response can be accounted for, at least in part, by an important change in the fatty acid composition of E. coli lipids. Specifically, under heat shock conditions at 45°C, Mejia et al.25 reported a significant increase in palmitic acid, as determined by gas chromatography, that correlates well with our own observations at elevated temperatures. Several other reports have highlighted the dependence of membrane fluidity and bacterial fatty acid profile, for example Shivaji et al.26 concluded that the fluidity of rigidified bacterial membranes can be restored after temperature variation (i.e. cold shock) by altering the levels of saturated and unsaturated fatty acids, and by altering the fatty acid chain length. The outer membranes of Gram-negative bacteria and LPS were reported to exhibit changes and fatty acid alterations in response to temperature adaptation.27,28
The Gram-negative response to temperature change includes multiple regulated changes in the expression of specific proteins and in the nature of the lipid composition of the outer and inner membrane.29–31 Alba and Gross29 reviewed the role of σE, the main response regulator to heat stress. This system controls the enzymes responses to involved unfolded envelope proteins by inducing four major proteins: RseA, an inner membrane σE antisigma factor; RseB, a periplasmic protein that binds to the periplasmic face of RseA; and the DegS and YaeL proteases.29 The interaction between σE and RseA is the major point of regulation and is controlled by the stability of RseA. The complex interactions between induced proteins and RseB, DegS and YaeL confer fine control on RseA and σE regulation. In addition, the σE system is involved in the regulation acyltransferases that modify the structure of the phospholipids and lipid A components of the inner membrane, and the LPS of the outer membrane.29,32 This alters the phospholipid composition of the inner membrane and the lipid A within the outer membrane qualitatively, thus modifying membrane fluidity, which appears to be a major factor dictating survival of heat stress. As described in this article, the introduction of unsaturated fatty acids into the lipid A structure appears to be a major factor in survival of increasing temperature.31,33,34 Our studies define the fine structure related to the changes in acylation seen in E. coli lpxL acyltransferase mutants and indicate that similar rules regarding membrane lipid composition and fluidity remain constant.
Supplementary Material
Acknowledgments
Funding
This work was supported by NIH grants AI 44642 (to MAA and BWG) and AI 24616 (to MAA and BWG).
Footnotes
Reprints and permissions: sagepub.co.uk/journalsPermissions.nav
References
- 1.Rietschel ET, Kirikae T, Schade FU, et al. Bacterial endotoxin: molecular relationships of structure to activity and function. Faseb J. 1994;8:217–225. doi: 10.1096/fasebj.8.2.8119492. [DOI] [PubMed] [Google Scholar]
- 2.Raetz CR, Whitfield C. Lipopolysaccharide endotoxins. Annu Rev Biochem. 2002;71:635–700. doi: 10.1146/annurev.biochem.71.110601.135414. [DOI] [PMC free article] [PubMed] [Google Scholar]
- 3.Clementz T, Bednarski JJ, Raetz CR. Function of the htrB high temperature requirement gene of Escherchia coli in the acylation of lipid A: HtrB catalyzed incorporation of laurate. J Biol Chem. 1996;271:12095–12102. doi: 10.1074/jbc.271.20.12095. [DOI] [PubMed] [Google Scholar]
- 4.Somerville JE, Jr, Cassiano L, Bainbridge B, et al. A novel Escherichia coli lipid A mutant that produces an antiinflammatory lipopolysaccharide. J Clin Invest. 1996;97:359–365. doi: 10.1172/JCI118423. [DOI] [PMC free article] [PubMed] [Google Scholar]
- 5.Karow M, Fayet O, Cegielska A, et al. Isolation and characterization of the Escherichia coli htrB gene, whose product is essential for bacterial viability above 33 degrees C in rich media. J Bacteriol. 1991;173:741–750. doi: 10.1128/jb.173.2.741-750.1991. [DOI] [PMC free article] [PubMed] [Google Scholar]
- 6.Karow M, Fayet O, Georgopoulos C. The lethal phenotype caused by null mutations in the Escherichia coli htrB gene is suppressed by mutations in the accBC operon, encoding two subunits of acetyl coenzyme A carboxylase. J Bacteriol. 1992;174:7407–7418. doi: 10.1128/jb.174.22.7407-7418.1992. [DOI] [PMC free article] [PubMed] [Google Scholar]
- 7.McLendon MK, Schilling B, Hunt JR, et al. Identification of LpxL, a late acyltransferase of Francisella tularensis. Infect Immun. 2007;75:5518–5531. doi: 10.1128/IAI.01288-06. [DOI] [PMC free article] [PubMed] [Google Scholar]
- 8.Schilling B, McLendon MK, Phillips NJ, et al. Characterization of lipid A acylation patterns in Francisella tularensis, Francisella novicida, and Francisella philomiragia using multiple-stage mass spectrometry and matrix-assisted laser desorption/ionization on an intermediate vacuum source linear ion trap. Anal Chem. 2007;79:1034–1042. doi: 10.1021/ac061654e. [DOI] [PMC free article] [PubMed] [Google Scholar]
- 9.Shaffer SA, Harvey MD, Goodlett DR, Ernst RK. Structural heterogeneity and environmentally regulated remodeling of Francisella tularensis subspecies novicida lipid A characterized by tandem mass spectrometry. J Am Soc Mass Spectrom. 2007;18:1080–1092. doi: 10.1016/j.jasms.2007.03.008. [DOI] [PMC free article] [PubMed] [Google Scholar]
- 10.Ting YS, Shaffer SA, Jones JW, et al. Automated lipid A structure assignment from hierarchical tandem mass spectrometry data. J Am Soc Mass Spectrom. 2011;22:856–866. doi: 10.1007/s13361-010-0055-y. [DOI] [PubMed] [Google Scholar]
- 11.Kukavica-Ibrulj I, Sanschagrin F, Peterson A, et al. Functional genomics of PycR, a LysR family transcriptional regulator essential for maintenance of Pseudomonas aeruginosa in the rat lung. Microbiology. 2008;154:2106–2118. doi: 10.1099/mic.0.2007/011239-0. [DOI] [PubMed] [Google Scholar]
- 12.Karow M, Georgopoulos C. Sequencing, mutational analysis, and transcriptional regulation of the Escherichia coli htrB gene. Mol Microbiol. 1991;5:2285–2292. doi: 10.1111/j.1365-2958.1991.tb02159.x. [DOI] [PubMed] [Google Scholar]
- 13.Neidhardt FC, Ingraham JL, Low KB, et al. Escherichia coli and Salmonella typhimurium: cellular and molecular biology. Washington, DC: American Society for Microbiology; 1987. p. 2813. [Google Scholar]
- 14.Karow M, Georgopoulos C. Isolation and characterization of the Escherichia coli msbB Gene, a multicopy suppressor of null mutations in the high-temperature requirement gene htrB. J Bacteriol. 1992;174:702–710. doi: 10.1128/jb.174.3.702-710.1992. [DOI] [PMC free article] [PubMed] [Google Scholar]
- 15.Karow M, Georgopoulos C. The essential Escherichia coli msbA gene, a multicopy suppressor of null mutations in the htrB gene, is related to the universally conserved family of ATP-dependent translocators. Mol Microbiol. 1993;7:69–79. doi: 10.1111/j.1365-2958.1993.tb01098.x. [DOI] [PubMed] [Google Scholar]
- 16.Jones BD, Nichols WA, Gibson BW, et al. Study of the role of the htrB Gene in Salmonella typhimurium virulence. Infect Immun. 1997;65:4778–4783. doi: 10.1128/iai.65.11.4778-4783.1997. [DOI] [PMC free article] [PubMed] [Google Scholar]
- 17.Nichols WA, Raetz CRH, Clementz T, et al. htrB of Haemophilus influenzae: determination of biochemical activity and effects on virulence and lipooligosaccharide toxicity. J Endotoxin Res. 1997;4:163–172. [Google Scholar]
- 18.Raetz CR. Bacterial endotoxins: extraordinary lipids that activate eucaryotic signal transduction. J Bacteriol. 1993;175:5745–5753. doi: 10.1128/jb.175.18.5745-5753.1993. [DOI] [PMC free article] [PubMed] [Google Scholar]
- 19.Vorachek-Warren MK, Carty SM, Lin S, et al. An Escherichia coli mutant lacking the cold shock-induced palmitoleoyltransferase of lipid A biosynthesis: absence of unsaturated acyl chains and antibiotic hypersensitivity at 12 degrees C. J Biol Chem. 2002;277:14186–14193. doi: 10.1074/jbc.M200408200. [DOI] [PubMed] [Google Scholar]
- 20.Sunshine MG, Gibson BW, Engstrom JJ, et al. Mutation of the htrB gene in a virulent Salmonella typhimurium strain by intergeneric transduction: strain construction and phenotypic characterization. J Bacteriol. 1997;179:5521–5533. doi: 10.1128/jb.179.17.5521-5533.1997. [DOI] [PMC free article] [PubMed] [Google Scholar]
- 21.Costello CE, Vath JE. Tandem mass spectrometry of glycolipids. Methods Enzymol. 1990;193:738–768. doi: 10.1016/0076-6879(90)93448-t. [DOI] [PubMed] [Google Scholar]
- 22.Bishop RE. The lipid A palmitoyltransferase PagP: molecular mechanisms and role in bacterial pathogenesis. Mol Microbiol. 2005;57:900–912. doi: 10.1111/j.1365-2958.2005.04711.x. [DOI] [PubMed] [Google Scholar]
- 23.Skovierova H, Rezuchova B, Homerova D, et al. Characterization of the sigmaE-dependent rpoEp3 promoter of Salmonella enterica serovar Typhimurium. FEMS Microbiol Lett. 2006;261:53–59. doi: 10.1111/j.1574-6968.2006.00325.x. [DOI] [PubMed] [Google Scholar]
- 24.Skovierova H, Rowley G, Rezuchova B, et al. Identification of the sigmaE regulon of Salmonella enterica serovar Typhimurium. Microbiology. 2006;152:1347–1359. doi: 10.1099/mic.0.28744-0. [DOI] [PubMed] [Google Scholar]
- 25.Mejia R, Gomez-Eichelmann MC, Fernandez MS. Fatty acid profile of Escherichia coli during the heat-shock response. Biochem Mol Biol Int. 1999;47:835–844. doi: 10.1080/15216549900201923. [DOI] [PubMed] [Google Scholar]
- 26.Shivaji S, Prakash JS. How do bacteria sense and respond to low temperature? Arch Microbiol. 2010;192:85–95. doi: 10.1007/s00203-009-0539-y. [DOI] [PubMed] [Google Scholar]
- 27.Kumar GS, Jagannadham MV, Ray MK. Low-temperature-induced changes in composition and fluidity of lipopolysaccharides in the antarctic psychrotrophic bacterium Pseudomonas syringae. J Bacteriol. 2002;184:6746–6749. doi: 10.1128/JB.184.23.6746-6749.2002. [DOI] [PMC free article] [PubMed] [Google Scholar]
- 28.Mansilla MC, Cybulski LE, Albanesi D, de Mendoza D. Control of membrane lipid fluidity by molecular thermosensors. J Bacteriol. 2004;186:6681–6688. doi: 10.1128/JB.186.20.6681-6688.2004. [DOI] [PMC free article] [PubMed] [Google Scholar]
- 29.Alba BM, Gross CA. Regulation of the Escherichia coli sigma-dependent envelope stress response. Mol Microbiol. 2004;52:613–619. doi: 10.1111/j.1365-2958.2003.03982.x. [DOI] [PubMed] [Google Scholar]
- 30.Klein G, Lindner B, Brabetz W, et al. Escherichia coli K-12 suppressor-free mutants lacking early glycosyltransferases and late acyltransferases: minimal lipopolysaccharide structure and induction of envelope stress response. J Biol Chem. 2009;284:15369–15389. doi: 10.1074/jbc.M900490200. [DOI] [PMC free article] [PubMed] [Google Scholar]
- 31.Mejia R, Gomez-Eichelmann MC, Fernandez MS. Escherichia coli membrane fluidity as detected by excimerization of dipyrenylpropane: sensitivity to the bacterial fatty acid profile. Arch Biochem Biophys. 1999;368:156–160. doi: 10.1006/abbi.1999.1275. [DOI] [PubMed] [Google Scholar]
- 32.Wahl A, My L, Dumoulin R, Sturgis JN, Bouveret E. Antagonistic regulation of dgkA and plsB genes of phospholipid synthesis by multiple stress responses in Escherichia coli. Mol Microbiol. 2011;80:1260–1275. doi: 10.1111/j.1365-2958.2011.07641.x. [DOI] [PubMed] [Google Scholar]
- 33.Ferguson GP, Datta A, Carlson RW, Walker GC. Importance of unusually modified lipid A in Sinorhizobium stress resistance and legume symbiosis. Mol Microbiol. 2005;56:68–80. doi: 10.1111/j.1365-2958.2005.04536.x. [DOI] [PubMed] [Google Scholar]
- 34.Shigapova N, Torok Z, Balogh G, et al. Membrane fluidization triggers membrane remodeling which affects the thermotolerance in Escherichia coli. Biochem Biophys Res Commun. 2005;328:1216–1223. doi: 10.1016/j.bbrc.2005.01.081. [DOI] [PubMed] [Google Scholar]
Associated Data
This section collects any data citations, data availability statements, or supplementary materials included in this article.