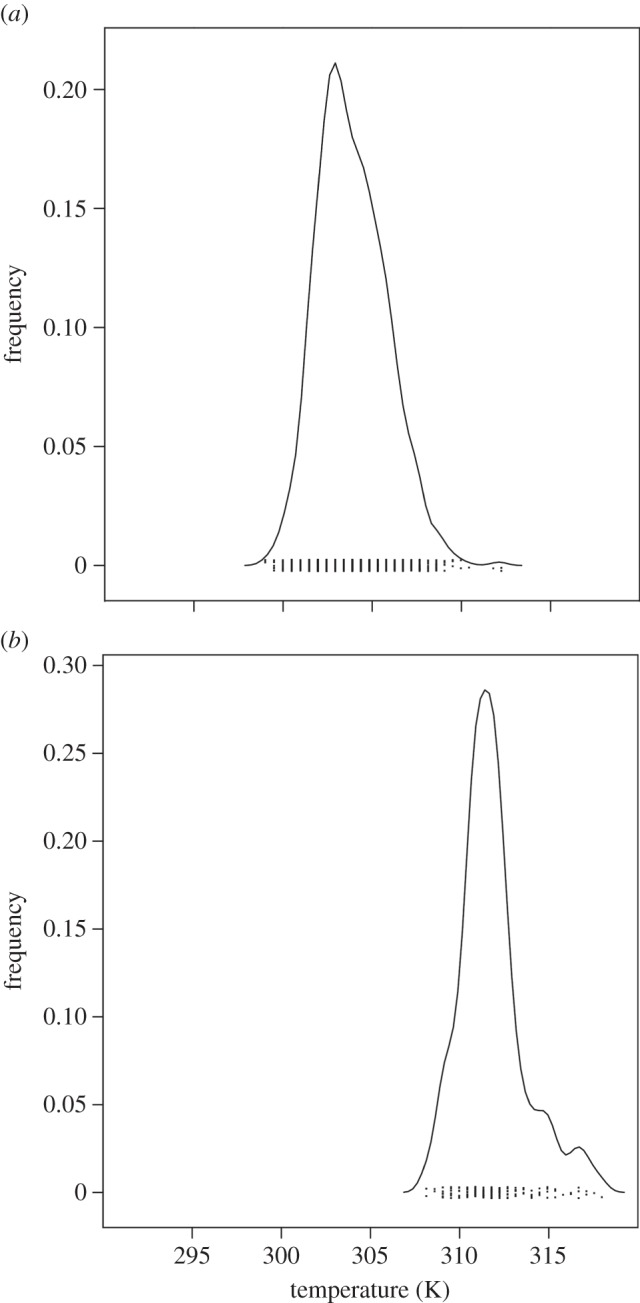
Figure 4.

The thermal signature of pixels classified as the oil flares landcover class (through band 6–1 of the Landsat ETM+ sensor; [77]) converted to surface temperature shows temperature between 303 and 312 K across pixels of this class; panel (a) depicts the frequency of surface temperature (K) for pixels of the class oil flares (N = 2039) for the results of the framework classification in Algeria, and panel (b) depicts the values (N = 221) for the application area in Niger.
