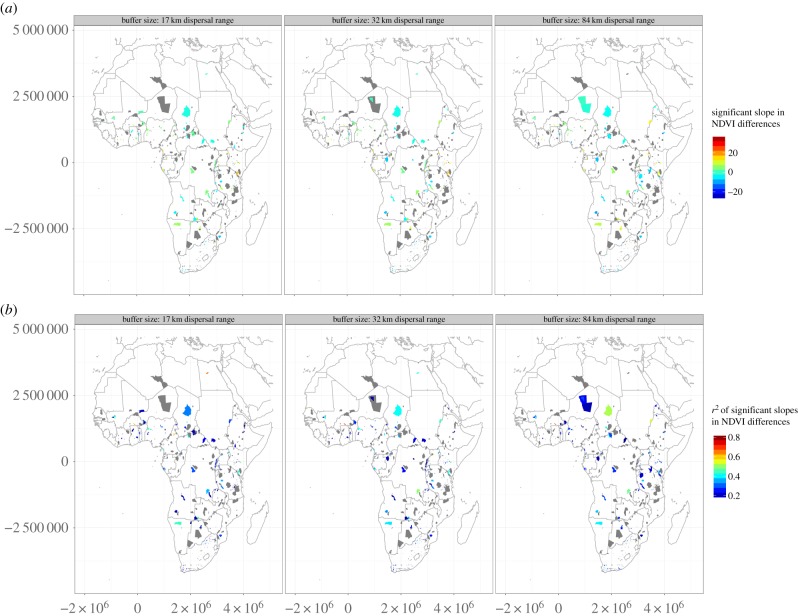
Figure 2.
Differences of NDVI values inside and outside PAs between 1982 and 2006 (slope values are displayed in the top row and r² values are displayed in the bottom row; values are derived from a linear regression of time against the difference in values). Grey areas experienced no significant change in differences across the time span 1982–2006. Row (a): red areas showed a decrease in the slope of the linear regression of NDVI outside, and blue areas a difference of increasing NDVI outside. Row (b): the r² values are showing high values of the linear regression fit in red, and low values in blue. (Online version in colour.)

