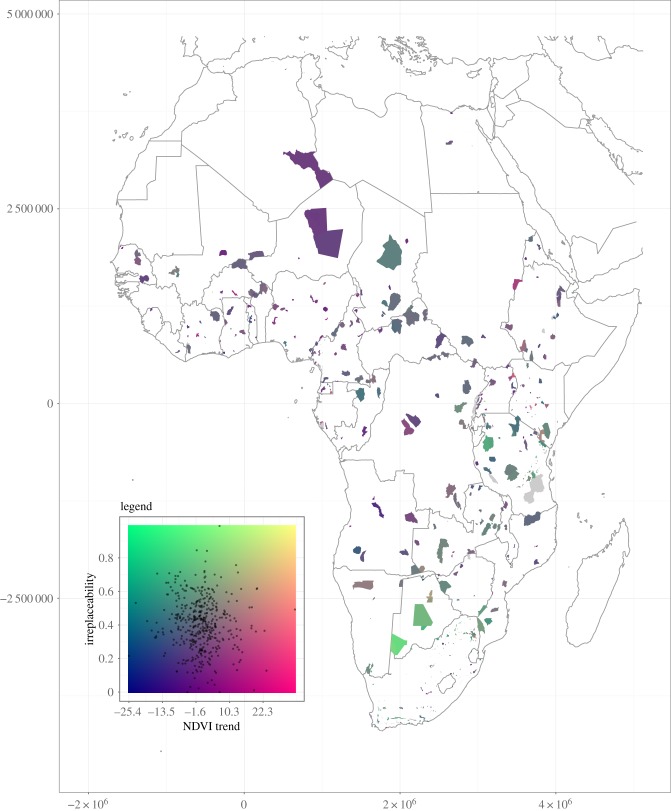
Figure 3.
Illustration of the combination of PA irreplaceability values and differences in NDVI trends inside and outside PAs. Green to yellow areas show high importance of PAs to maintain the connectivity of species ranges, blue to red colouring depicts low importance. Horizontal colouring represents the rate of vegetation cover change inside versus outside and around PAs. Blue indicates faster vegetation loss inside PAs than outside or a stronger increase outside, red indicates faster vegetation loss outside or increase inside PAs (isolation). (Online version in colour.)

