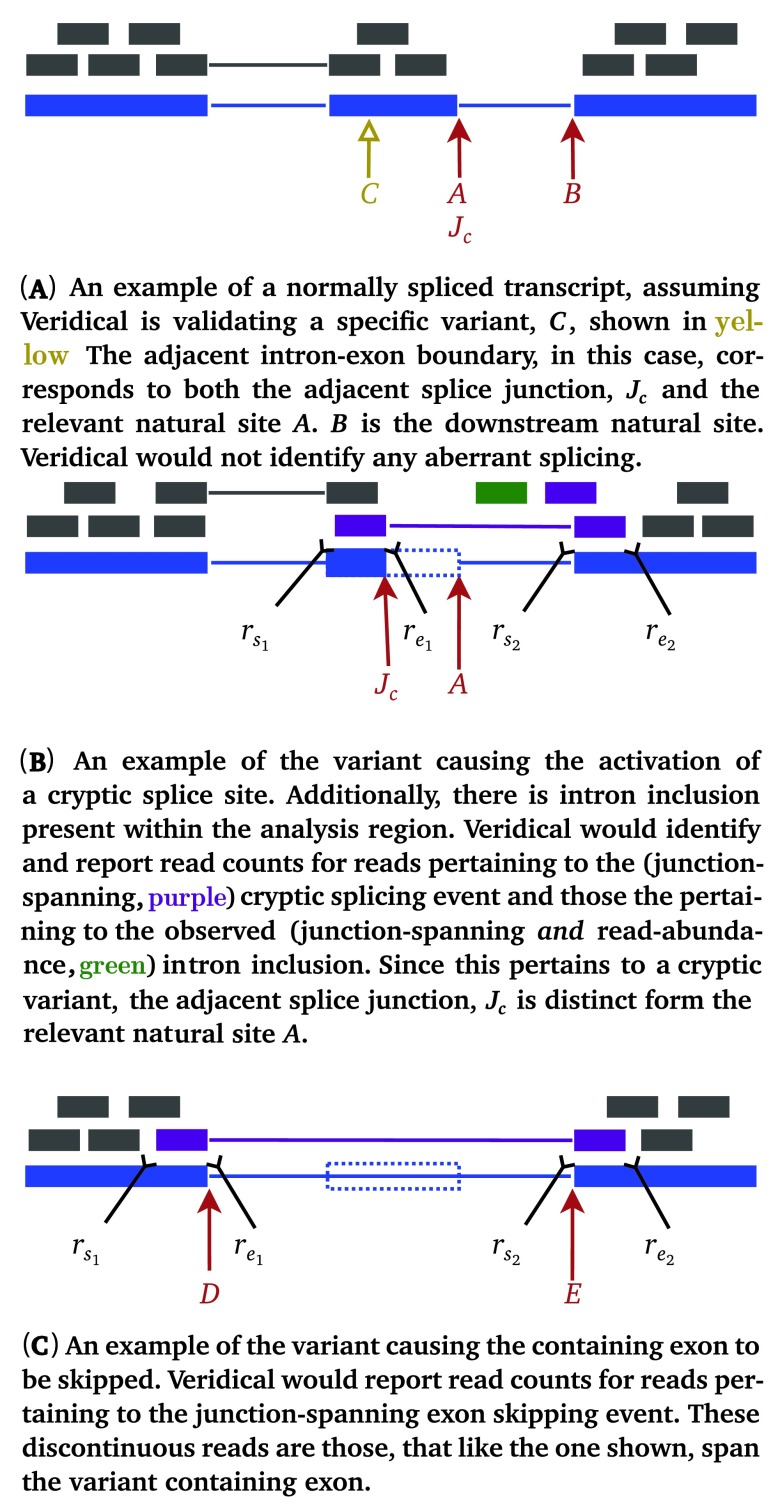
Figure 2.
Illustrative examples of aberrant splicing detection. Grey lines denote reads, wherein thick lines denote a read mapping to genomic sequence and thin lines represent connecting segments of reads split across spliced-in regions (i.e. exons or included introns). Dotted blue rectangles denote portions of genes which are spliced out in a mutant transcript, but are otherwise present in a normal transcript. Mutant reads are purple if they are junction-spanning and green if they are read-abundance based. Start and end coordinates of reads with two portions are denoted by ( r s1, r e1) and ( r s2, r e2), while coordinates of those with only a single portion are denoted by ( r s, r e). Refer to the caption of Figure 1 for additional graphical element descriptions.

