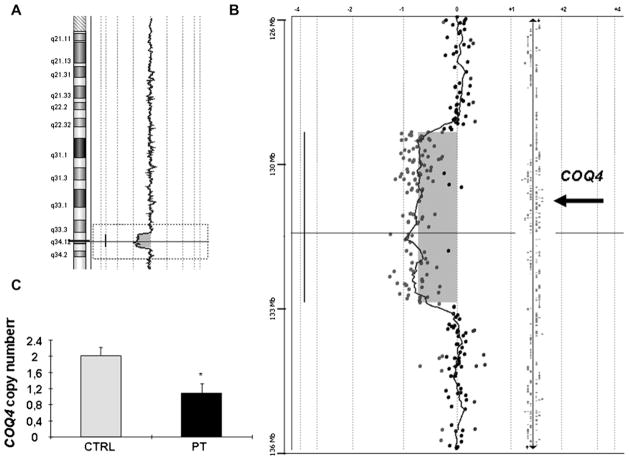
Figure 1.
(A) Array comparative genomic hybridisation (Agilent 44 K chip) of PT 1 showing the 3.9 Mb deletion: profile of chromosome 9 showing a series of spots having an about −1 log2 ratio at 9q34.11-q34.13. (B) Enlargement of the deleted region ranging from 129 531 to 133 523 Mb (assembly hg18). Oligos at 129 481 and 133 575 Mb resulted in normal log2 ratio. The quality of the experiment has been considered excellent on the bases of QC metric parameters (DNA analytics). The arrow indicates the position of the COQ4 gene within the deleted region. (C) COQ4 copy number in genomic DNA of cultured skin fibroblasts of the patient determined by real-time quantitative PCR.

