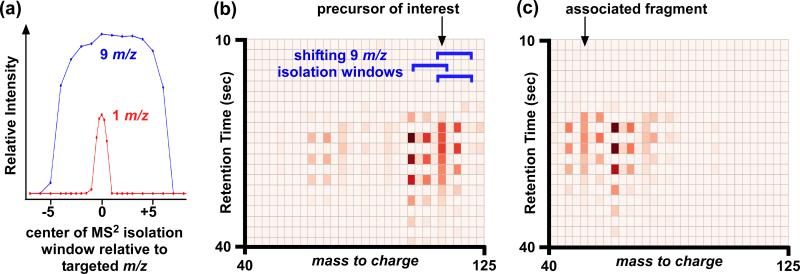
Figure 2. Basis of deconvolution approach.
(a) MS2 isolation window shapes for Agilent 6520 QTOF. Using a larger MS2 isolation window increases the likelihood of isolating more than 1 precursor in the collision cell for MS2 analysis, but also improves the relative intensity of ions transmitted. Representative (b) MS2 at 0 V and (c) MS2 at 20 V data used for deconvolution over a 30 second chromatographic window. Each box in the plots represents a single scan. Peak intensity is denoted by color, with bright red representing the most intense peaks. The blue brackets indicate the position of the 9 Da MS2 isolation window used. Ion intensities that are high and low in alternating scans (i.e., bright red followed by light red) are ions that are included and excluded respectively with shifts in the position of the MS2 isolation window. Our deconvolution approach is based on identifying matching patterns in the MS2 plots at 0 and 20 V. An example of a matched precursor and associated fragment is shown with arrows.

