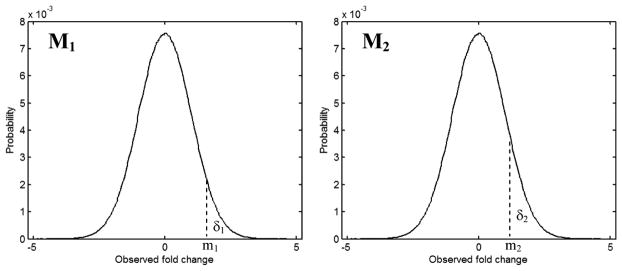
Figure 1.

Illustration of the method for estimating noise in microarray data. The curves are the distributions of probability (y-axis) of observed fold changes (x-axis) for genes in two microarray data sets M1 and M2. δ1 represents the genes with observed fold change values greater than m1 in M1, and δ2 the genes with observed fold change values greater than m2 in M2
