
Fig. 2.
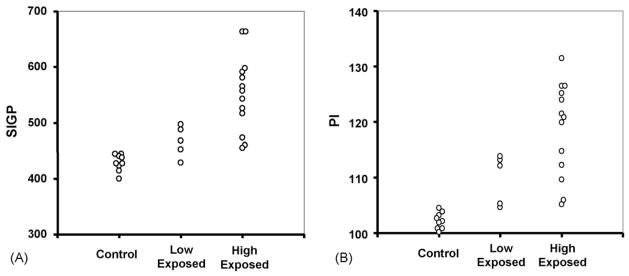
Scatter dot-plots of the distribution of individual MRI scores among control, low and high Mn-exposed workers. (A) Signal intensity in globus pallidus (SIGP); (B) pallidal index (PI), which is defined as the ratio of SIGP to that in the subcortical frontal white matter (SIFW) in axial T1-weighted MRI planes multiplied by 100.