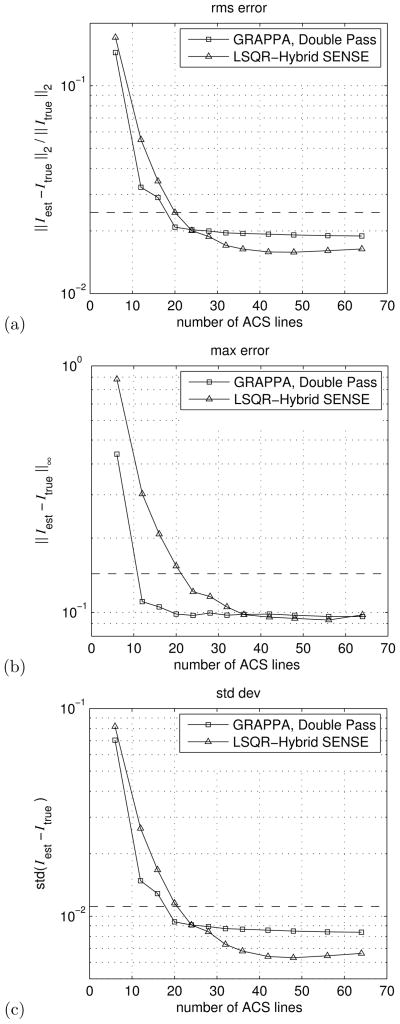
Figure 4.
Graphic comparison of (a) root-mean-square error, (b) maximum error, and (c) standard deviation of the error between the Double Pass GRAPPA, and LSQR-Hybrid SENSE reconstructions and the fully-sampled phantom image. Each of the error metrics is defined in the labels on the vertical axis of each panel. For comparison, the error metrics for Single Pass GRAPPA using 6 ACS lines is shown as a dashed line on each graph.

