FIGURE 2.

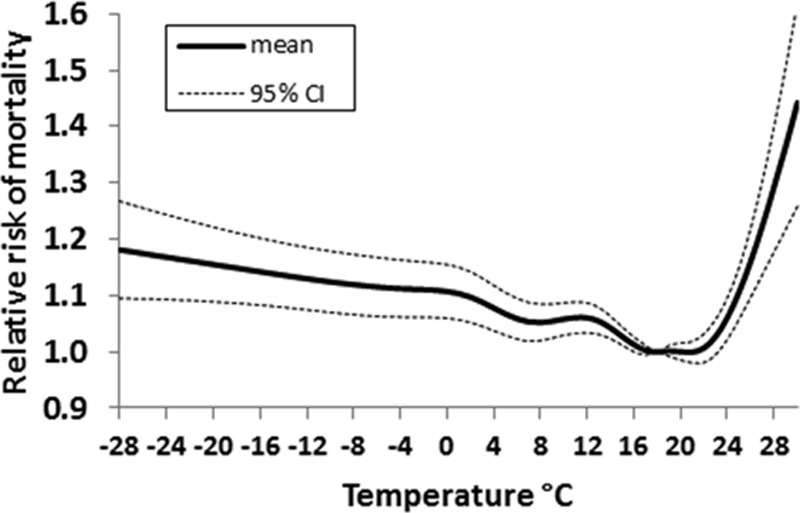
Relative increase in nonaccidental mortality 2006–2010 in Moscow related to temperature, averaged over 1 week, compared with a temperature of 18°C. The graphs indicate mean relative increase and 95% confidence interval.

Relative increase in nonaccidental mortality 2006–2010 in Moscow related to temperature, averaged over 1 week, compared with a temperature of 18°C. The graphs indicate mean relative increase and 95% confidence interval.