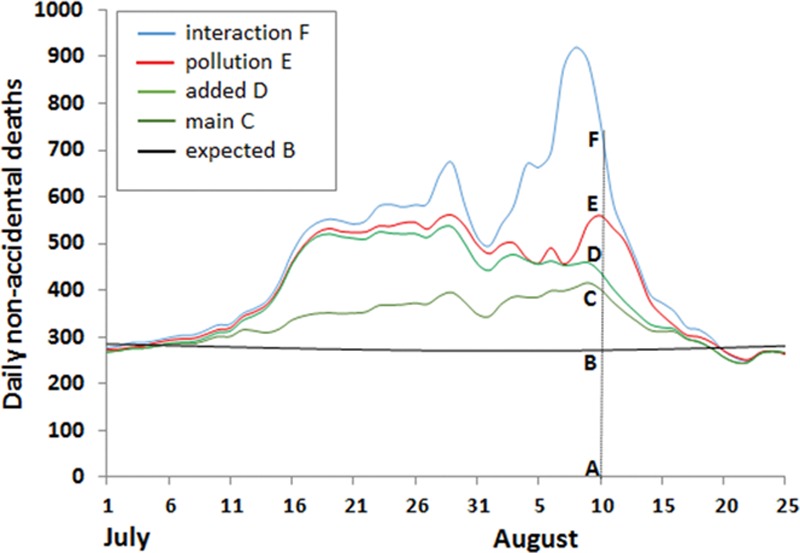
FIGURE 4.

Estimated contributions from temperature, air pollution, and their interaction to daily number of nonaccidental deaths in Moscow during the heat wave period in the summer of 2010. “Interaction” is between PM10 and temperature; “pollution” is PM10 and ozone; “added” is the heat wave effect in addition to the temperature effect; and “main” is the temperature effect.
