
Figure 2.
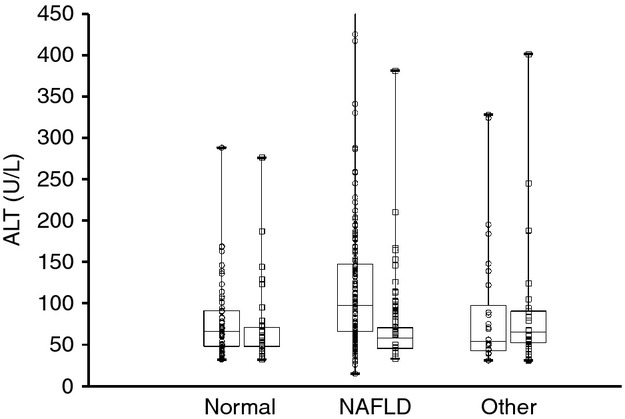
Box and whiskers plot for screening ALT separated by final diagnosis: no liver disease, NAFLD, or liver disease other than NAFLD. Within each diagnostic category, data are shown separately for boys (○) and girls (□).The horizontal lines inside the boxes represent the median, the box edges show the lower and upper quartiles and the whiskers show the minimum and maximum values. The Y axis was truncated at 450 U/L. Only the group of boys with NAFLD included outliers with screening ALT above 450 U/L.