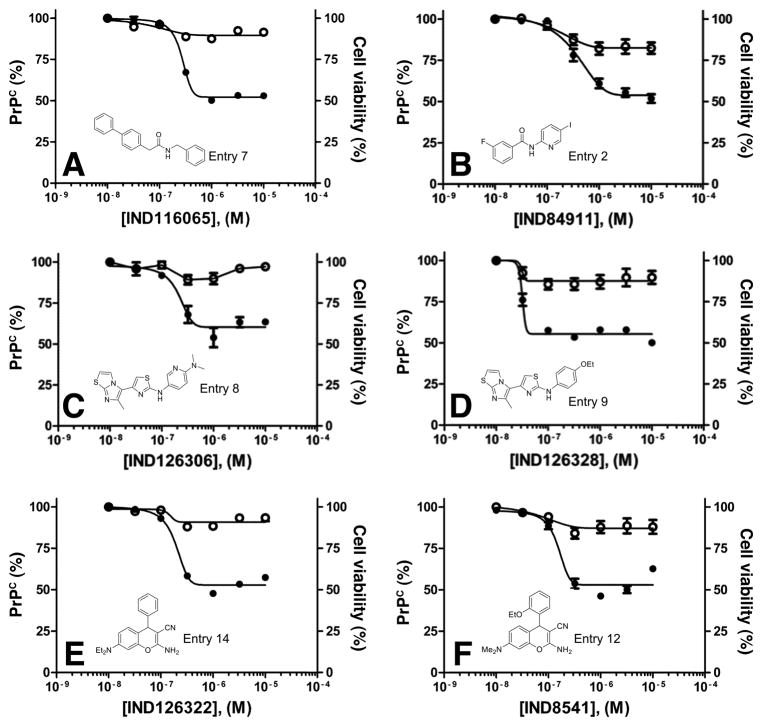
Figure 3.
Dose-response curves for potency (EC50 by ELISA; filled circles) and cell viability (LC50 by calcein assay; open circles) for two potent confirmed SPC hits in T98G cells from each of three representative scaffolds: amide (A and B), aminothiazole (C and D), and chromene (E and F). Percentages were normalized to the maximal absorbance measured at the highest concentration tested. See Table 3 for exact EC50 values.

