Figure 5.

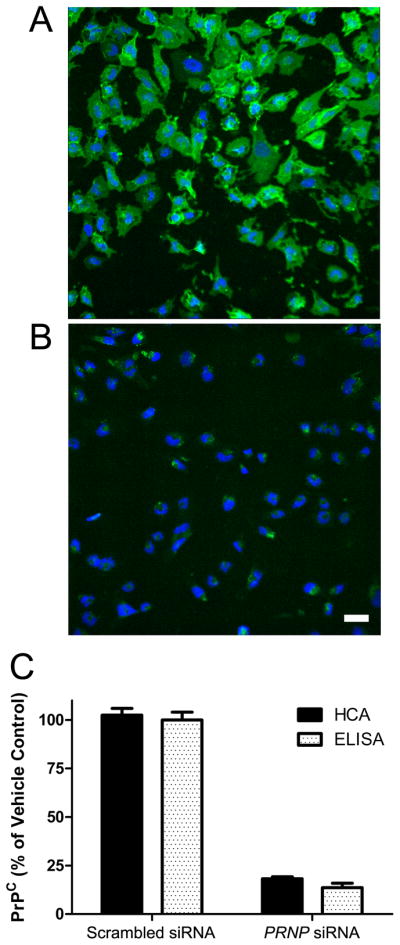
PrPC expression on the surface of T98G glioblastoma cells after 2 d of treatment with scrambled siRNA (A) or 25 nM PRNP siRNA (B), and quantified (C) by high content analysis (HCA, solid bars) and ELISA (open bars). In B, scale bar represents 50 μm and also applies to A. In A and B, PrP is stained with anti-PrP antibody (green) and cell nuclei stained with DAPI (blue). In C, data were normalized to scrambled siRNA control. Bars represent mean ± standard error of the mean from three independent experiments.
