
Figure 7.
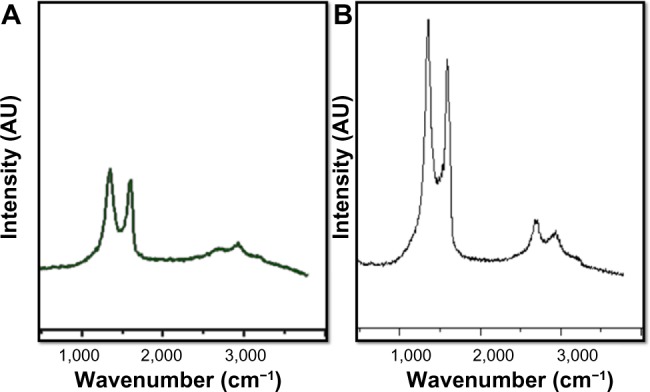
Raman spectroscopy analyses of GO and GE-rGO samples.
Notes: Raman spectra were obtained using a laser excitation of 532 nm at a power of <1 mW. The figure shows representative Raman spectra of GO and GE-rGO samples after removal of the fluorescent background. The intensity ratios of the D-peak to the G-peak were 1.8 and 2.1 for GO (A) and GE-rGO (B), respectively. At least three independent experiments were performed for each sample and reproducible results were obtained.
Abbreviations: GE, Ganoderma extract; GO, graphene oxide; GE-rGO, GE-reduced GO.