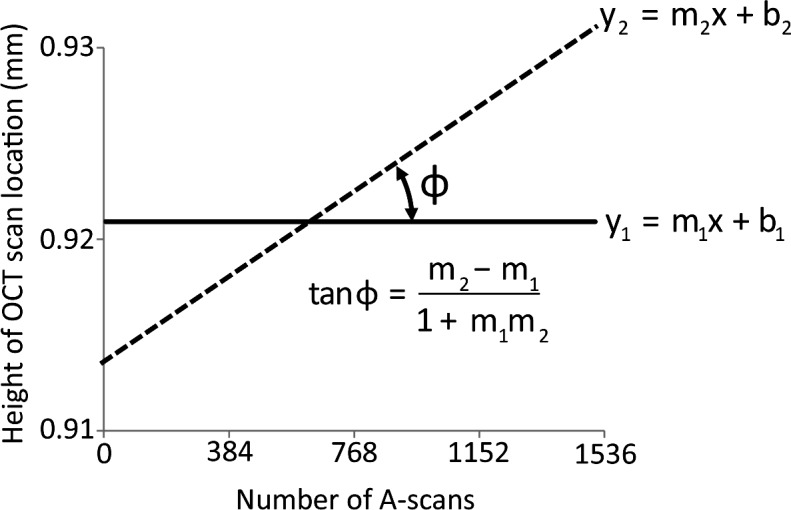
Figure 2. .

Method to determine the precision of SD-OCT scan line placement for repeated imaging. The precision of OCT scan line placement was quantified from scan line position within the SLO fundus images. The follow-up SLO image was registered with the baseline SLO image. The B-scan locations between images were then extracted from the registered SLO images and plotted against the baseline scan location. The x-axis represents the individual A-scan number (pixel column) in each OCT B-scan image; the y-axis is the scan location within the SLO retinal image relative to the optic nerve head center. The solid (y1) and dashed (y2) lines represent the locations of the OCT B-scans during the first and second imaging sessions. The slopes of these lines were used to calculate the angle between the two lines. An angle close to zero suggests minimal differences in retinal location between the two imaging sessions.
