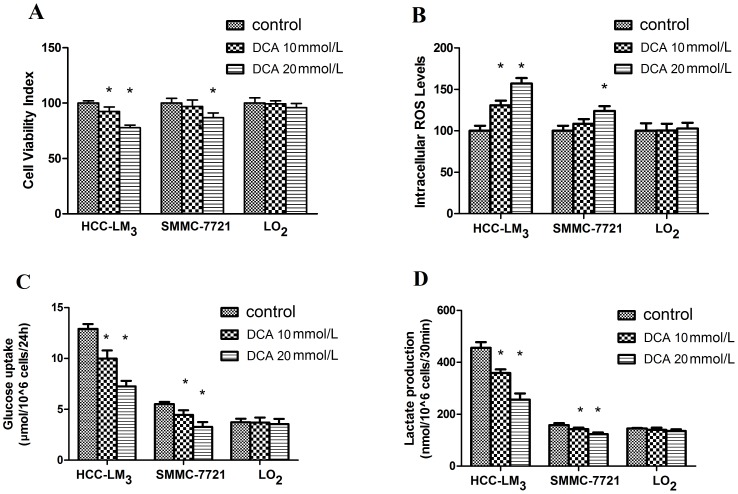
Figure 1. Effect of DCA on cell viability, intracellular ROS levels and glucose metabolism in hepatoma cells after 48/L DCA.
(A) Cell viability was determined as described above. 20 mmol/L DCA treatment decreased viability of the 2 hepatoma cell lines but not the normal hepatocyte cell line LO2. DCA at 10 mmol/L reduced cell viability significantly only in HCC-LM3 cells; (B) 20 mmol/L DCA treatment resulted in elevated intracellular ROS generation in hepatoma cell lines but not LO2. DCA at 10 mmol/L induced ROS level increase only in HCC-LM3 cells; (C) DCA at 10 and 20 mmol/L inhibited glucose uptake in both hepatoma cell lines but not LO2; (D) DCA at 10 and 20 mmol/L inhibited lactate production in both hepatoma cell lines but not LO2. * indicates statistical significance versus control cells (p<0.05). Each experiment was performed in triplicate, and all tests were repeated at least 3 times to provide this data.

