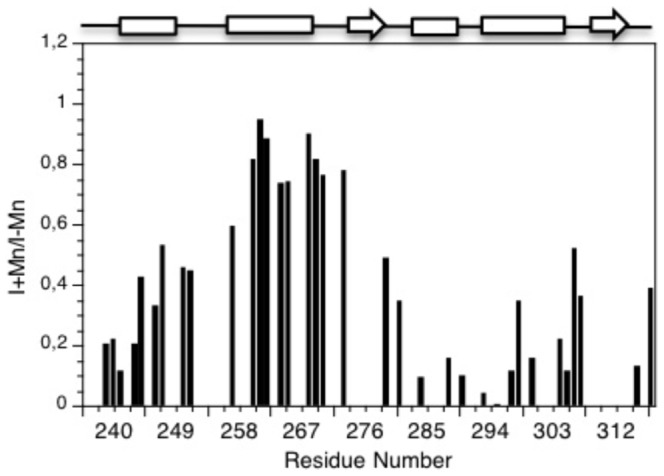
Figure 3. Ratio of the peak intensities of the two 15N-1H HSQC spectra (presence of Mn/absence of Mn).

Overlapping peaks were not analysed. The secondary structure is displayed on the top of the figure with helices represented as rectangles and β strands as arrows.
