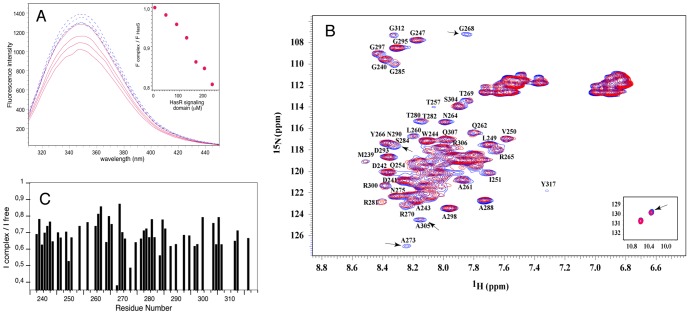
Figure 6. Interaction between HasSCTD and the signaling domain probed by NMR and fluorescence.
(A) Change of the fluorescence emission spectra of HasSCTD upon titration with the signaling domain (solid red lines) and control spectra for HasSCTD dilution with the buffer (dashed blue lines). Figure in the inset presents the ratio of the fluorescence intensity (at 350 nm) of HasSCTD in complex and HasSCTD alone, plotted versus the signaling domain concentration. (B) 1H-15N HSQC spectra of HasSCTD alone (blue) and in the presence of unlabeled signaling domain (red). Some of the most affected residues are pointed out and resonances of tryptophan side chain are shown in the inset. The concentrations of HasSCTD and the HasR signaling domain were 250 µM and 800 µM, respectively. (C) Ratio of the peak intensity of two 15N-1H HSQC spectra of 15N labeled HasSCTD (in the presence and absence of the unlabeled signaling domain).

