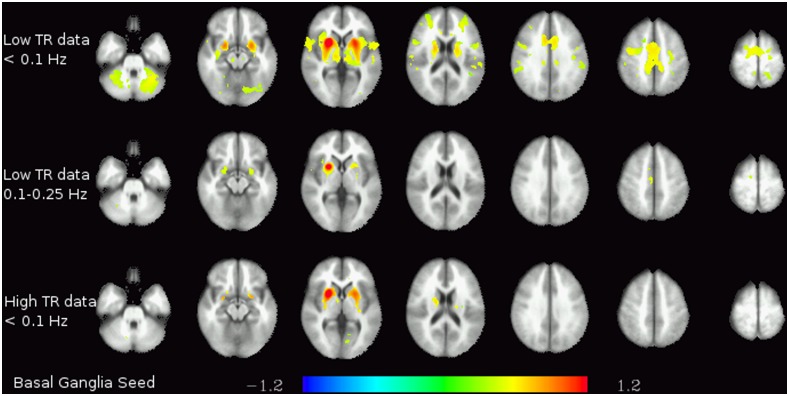
Figure 3. Basal ganglia functional connectivity.

Functional connectivity of the basal ganglia seed in the lowest frequency band (<0.1 Hz) in the low-TR (top) and high-TR (bottom) datasets. The colors represent z-transformed correlation coefficients.

Functional connectivity of the basal ganglia seed in the lowest frequency band (<0.1 Hz) in the low-TR (top) and high-TR (bottom) datasets. The colors represent z-transformed correlation coefficients.