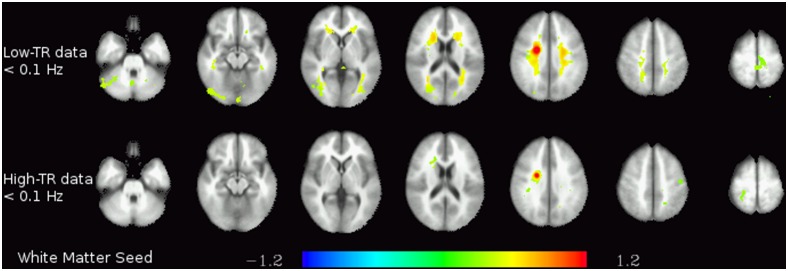
Figure 4. White matter functional connectivity.

Functional connectivity of the white matter seed in the two lower frequency bands (<0.1 Hz and 0.1–0.25 Hz) in the low-TR (top) and high-TR (bottom) datasets. The colors represent z-transformed correlation coefficients.
